

RI Ranked 10th Greenest State in U.S.
GoLocalProv News Team
RI Ranked 10th Greenest State in U.S.

According to a recent study, Rhode Island is the 10th greenest state in the U.S., but the fifth greenest state in New England.
“In the past year, the U.S. has seen an especially devastating amount of natural disasters. According to National Geographic, 17 storms caused an estimated $200 billion in property damage. Hurricane Maria, for example, left Puerto Rico without power for months and severely hurt the territory’s economy. Experts attribute the high number of hurricanes to unusually warm Atlantic waters, so it’s possible that living more sustainably and using greener energy sources could prevent us from having quite as bad hurricane seasons in the future,” said WalletHub.
GET THE LATEST BREAKING NEWS HERE -- SIGN UP FOR GOLOCAL FREE DAILY EBLASTRI’s Rankings
- 20th Best – Air Quality
- 11th Best – Water Quality
- 2nd Best – Energy Consumption per Capita
- 3rd Best – Gasoline Consumption (in Gallons) per Capita
- 1st – Nitrous-Oxide Emissions per Capita
The Rankings
Rhode Island ranks behind New Hampshire and California, who rank eighth and ninth respectively.
Rhode Island ranks ahead of Maine and Nevada, who rank 11th and 12th respectively.
Vermont is ranked as the greenest state in the U.S., while West Virginia is ranked last.
See the full rankings in the map below
The Method
In order to determine the greenest states, WalletHub compared the 50 states across three key dimensions: 1) Environmental Quality, 2) Eco-Friendly Behaviors and 3) Climate-Change Contributions.
They evaluated those dimensions using 23 relevant metrics. Each metric was graded on a 100-point scale, with a score of 100 representing the highest level of eco-friendliness.
They then determined each state’s weighted average across all metrics to calculate its total score and used the resulting scores to rank-order our sample.
Environmental Quality – Total Points: 35
- Total Municipal Solid Waste per Capita: Full Weight (~7.00 Points)
- Air Quality: Full Weight (~7.00 Points)
- Water Quality: Full Weight (~7.00 Points)
- Soil Quality: Full Weight (~7.00 Points)
- Energy-Efficiency Score: Full Weight (~7.00 Points)
Eco-Friendly Behaviors – Total Points: 35
- Green Buildings per Capita: Full Weight (~2.50 Points)
- Total Capacity of Solar PV Systems Installed per Household: Full Weight (~2.50 Points)
- Share of Renewable Energy Consumption: Full Weight (~2.50 Points)
- Energy Consumption per Capita: Full Weight (~2.50 Points)
- Gasoline Consumption (in Gallons) per Capita: Full Weight (~2.50 Points)
- Daily Water Consumption per Capita: Full Weight (~2.50 Points)
- Share of “Smart” Electricity Meters: Full Weight (~2.50 Points)
- Alternative-Fuel Vehicles per Capita: Full Weight (~2.50 Points)
- Alternative-Fuel Stations per Capita: Full Weight (~2.50 Points)
- Green Transportation: Full Weight (~2.50 Points)
- Average Commute Time by Car: Full Weight (~2.50 Points)
- Share of Recycled Municipal Solid Waste: Full Weight (~2.50 Points)
- Certified Organic Farms per Capita: Full Weight (~2.50 Points)
- Corporate Clean Energy Procurement Index Score: Full Weight (~2.50 Points)
Climate-Change Contributions – Total Points: 30
- Carbon-Dioxide Emissions per Capita: Full Weight (~7.50 Points)
- Methane Emissions per Capita: Full Weight (~7.50 Points)
- Nitrous-Oxide Emissions per Capita: Full Weight (~7.50 Points)
- Fluorinated Greenhouse-Gas Emissions per Capita: Full Weight (~7.50 Points)
24 Ways to Go Green This Fall - 2018

Carve Fewer Jack-O-Lanterns
Halloween celebrators beware!
According to the U.S. Energy Department, pumpkins cause major waste issues each year on Halloween. The majority of the 1.3 billion pounds of pumpkins produced in the U.S. end up in dumps and landfills, according to the Energy Department’s website.

Use Pinecones as Natural Bird Feeder
Are you an ornithology enthusiast? Do you love the sights and sounds of songbirds outside your window?
Keep your feathered friends returning to your yard by using a pinecone as a natural bird feeder. Recycle pinecones found in your yard by adding birdseed and peanut butter to your pinecone.
Find more instructions here.
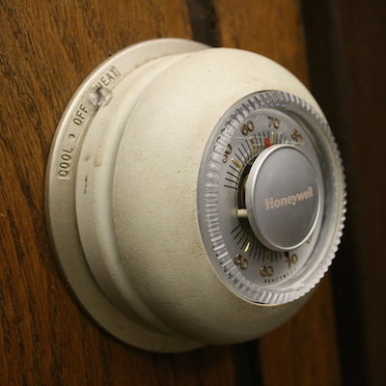
Turn Down the Thermostat
In order to save some energy (and some money) turn down your house's thermostat a few degrees this fall. You may not notice the difference, but the environment sure will.
Save on Energy's Gabi Itzler says to keep the thermostat at 68 degrees.
If you're still a little cold, throw on a sweatshirt. For even more savings, turn your heat down even lower when your family leaves for work school or a vacation.
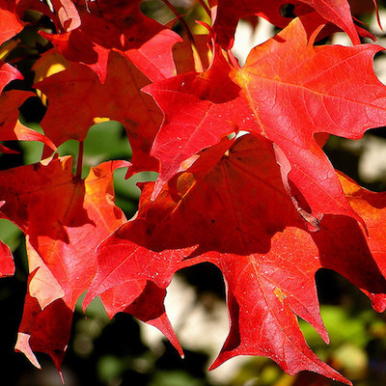
Put Down The Leaf Blower
When it comes time to get all the fallen leaves off of your lawn, don't reach for your electric or gas-powered leaf blower. Appliances like those can release pollutants into the atmosphere, and that is definitely not going green.
Instead, use manual lawn tools like a rake to save energy.
"Once you're done, reuse the leaves by transforming them into mulch for your plants or compost them to enrich your soil," wrote Itzler.

Plant Some Bulbs
Think fall is for harvesting, not for planting? Think again!
Fall is the perfect time to plant spring-flowering plants like tulips to make sure you have gorgeous flowers when warmer weather rolls around again next year.
For more tips on fall planting, click here.
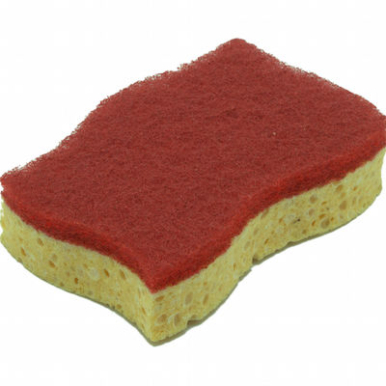
Green Cleaning
Preparing for your holiday? Want to make sure your house is sparkling clean for your friends family and other guests?
Well, instead of using chemical-ridden commercial cleaners, try using homemade, all natural cleaning supplies. All you need are a few comments lemons, vinegar, and baking soda.
For more information, click here.
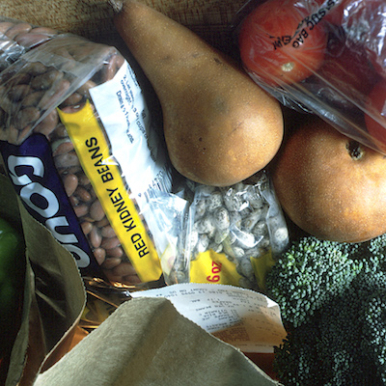
Make Fewer Trips to Grocery Store
If you're headed to the grocery store to pick up food and supplies for your next party try to make as few trips as possible. You'll save money on gas, and have to drive less, making this a perfect way to go green.
If you can, try to get all your items at one store. This way, you'll use even less gas when shopping.
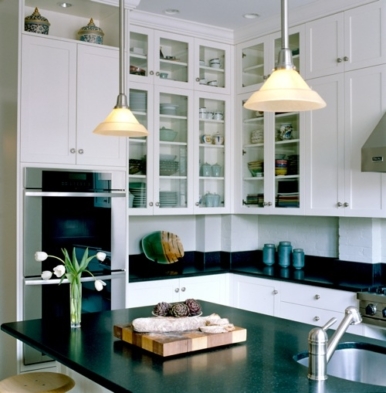
Cooking and Baking
Making changes in the kitchen can help you go green as well.
They also add that when using the oven, make the most of it. For example, cooking more than one thing at a time.
Use Cloth Towels Instead
When you go to clean up the next glass of spilled milk don't cry—and don't reach for any paper towels.
Instead, try a cloth towel or rag. You can wash them repeatedly, save money on paper towels, and save the environment by creating less waste.
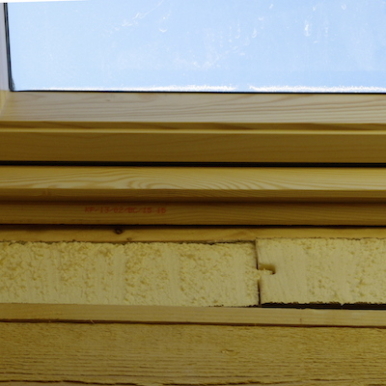
Seal Drafts
To keep the cold fall wind out of your home, and keep your warm air inside, be sure to seal up any drafts around windows or doors in your house or apartment.
"If your air conditioning was running non-stop all summer, then you might have unnoticed leaks in your home. Before it gets too cold, check all your doors and windows for drafty chills that could keep your heater running non-stop too," writes Itzner.
Drafts can do serious damage to your heating bill, and will be a major drain on energy usage, so make sure to seal them up soon.
For more information on how to seal them, click here.
Insulate Your Home
Insulation is one of the best ways to save money and energy in your home. Insulation will keep the cold air out of your home, and, better yet, keep the warm toasty air right inside your house where you want it.
If you better the insulation in your home, not only will your home be warmer, you'll go green and save money on your heating costs.
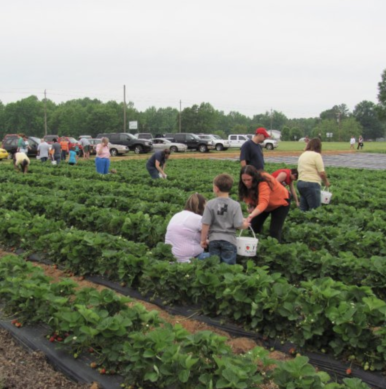
Visit a Pick-Your-Own Farm
Visit a pick-your-own farm and grab some of the freshest food that you can find.
Save on Energy writes, "visit a pick-your-own farm for fresh produce such as apples, pumpkins, and root vegetables. You may even find locations that let you pick fresh nuts such as pecans or walnuts."
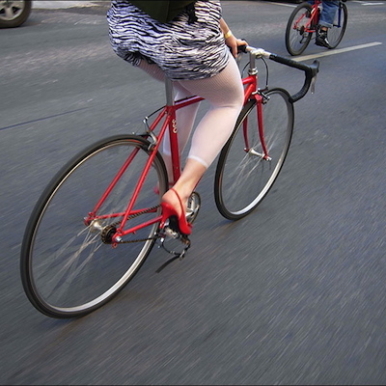
Walk & Bike More
There are only a few more weeks before the temperatures here in New England start to really dip to frigid numbers.
Enjoy the cool, crisp weather of fall and walk or ride your bike. You'll save on gas, save the environment, and it's good for you!
When it comes to getting to work, World Watch Institute says to "consider telecommuting if you live far from your work."
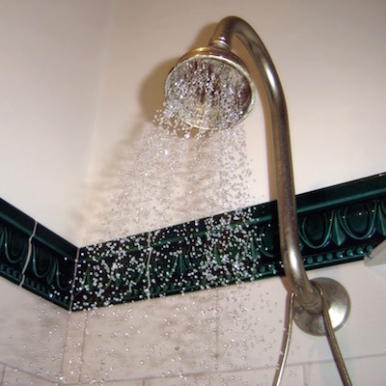
Take Shorter Showers
Who doesn't love the feeling of a nice hot shower after spending some time outdoors in the brisk fall air?
Only one problem—those long showers waste lots of water. Try taking shorter showers in order to go green this fall.
Along with taking shorter showers, World Watch suggests Installing a low-flow showerhead.
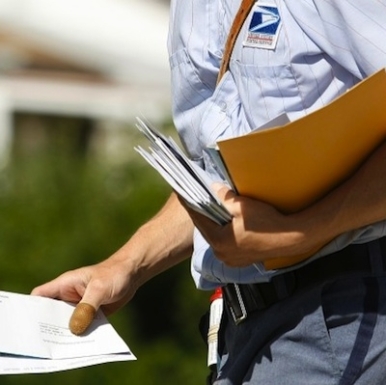
Opt-Out of Junk Mail
Junk mail is the worst. No one likes it, and it only serves to clutter up our homes, trash cans and landfills. But, did you know there is a way to "opt-out" of junk mail?
You can get off most unsolicited mail lists simply by calling 1-888-5-OPTOUT (1-888-567-8688).
Also, instead of browsing through catalogs, look at products online—most catalog companies publish online versions of their products, perfect for saving paper and going green.
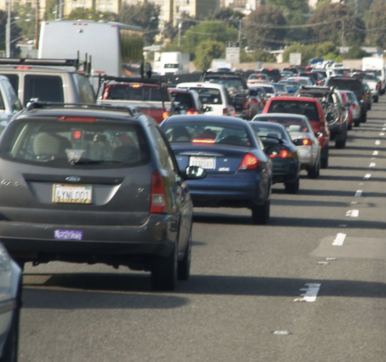
Car Pool
During the holiday season, there is plenty of energy to be saved on the highway by sharing rides with family members or friends headed to the same place.
Before you’re going somewhere, start thinking about who you might be able to carpool with and make arrangements so one car instead of two or three are on the road for the trip. Even if it’s just for a few miles, this adds up and can reduce gridlock and air pollution.
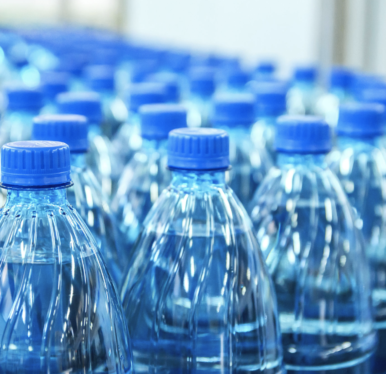
Ditch Bottled Water
Everyone knows that water is the healthiest beverage option, but next time, instead of grabbing for a bottle of water, drink tap water out of a reusable cup or bottle.
World Watch says "use a water filter to purify tap water instead of buying bottled water. Not only is bottled water expensive, but it generates large amounts of container waste."
You can buy reusable water bottles at nearly any department or home goods store, and you'll save money by not constantly paying for bottled water.
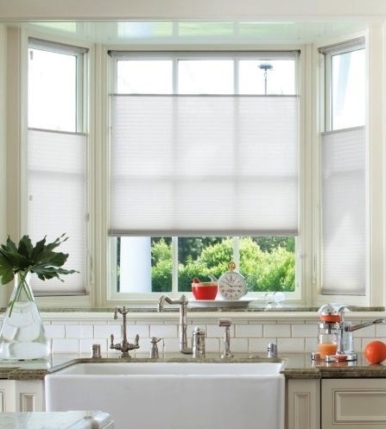
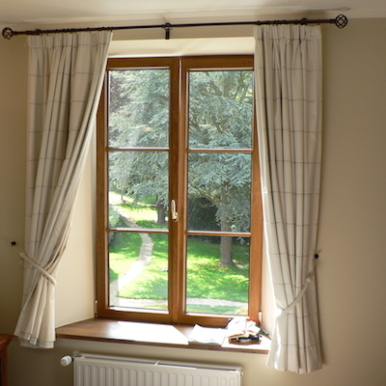
Open The Shades to Let Natural Light in
Few things can warm a room as well as the sun. Those warm rays of the sun can heat homes, even when temperatures outside begin to dip.
"Before you go to work, open your blinds or curtains in your home where the sun shines most. When you get home, don't forget to close them to lock in your free heat. In areas where your home doesn't get much sun, especially in areas shaded from trees, keep your curtains and blinds closed," writes Save on Energy's Craven.
In order to save energy and reduce heating costs, open your shades during sunny days, even on colder days. The sun's radiation will do the work so your home heating system doesn't have to.
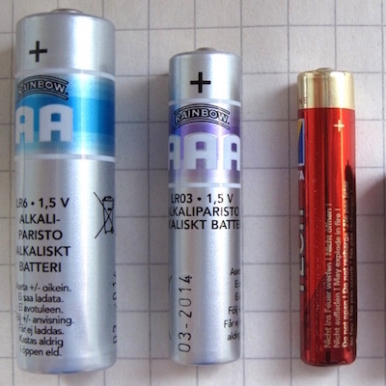
Recycle Batteries
Changing the batteries to your smoke detector when you switch your clocks this Sunday? Make sure to recycle your batteries rather than throwing them away.
Recycling your batteries keeps them out of the landfill, where heavy metals may leak into the ground when the battery casing corrodes, causing soil and water pollution. If batteries are incinerated with household waste, the heavy metals in them may cause air pollution.
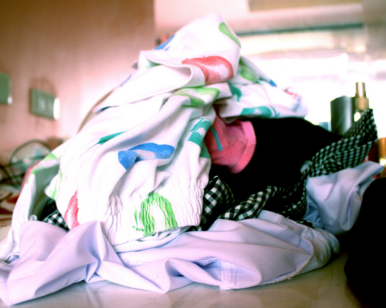
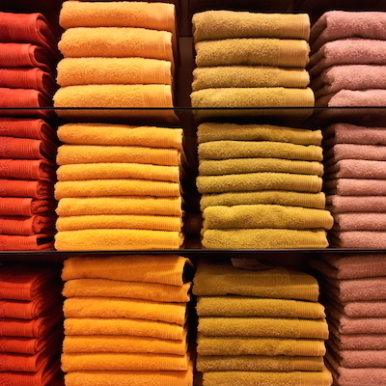
Donate Old Clothes
With the changing of the seasons comes the changing over of the closet from summer clothes to warmer clothes.
If you come across clothes that you don't wear, donate them to a local shelter or thrift store, instead of just holding onto them.
"Donate unwanted clothes to a thrift store so these unused garments can have a new life somewhere else," writes Itzler.

Schedule a Home Energy Audit
Want to know exactly how much energy you could be saving? Then schedule a home energy audit.
You can learn about opportunities for making your home more energy efficient and affordable.
For more on home energy audits, visit National Grid's website.
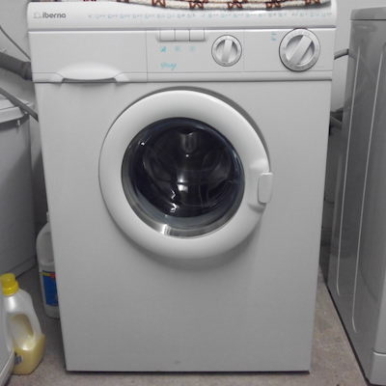
Don't Dry, Clean Only
Dry cleaning is far more harmful to the environment than your standard load of laundry done in a conventional washing machine.
If you have clothes that can be machined washed rather than dry cleaning, try giving them a run through the washer. And, if you're in the market for a new wardrobe, don't buy clothes with the "dry-clean only" label on them.
"Wash clothes in cold water whenever possible. As much as 85 percent of the energy used to machine-wash clothes goes to heating the water.
Use a drying rack or clothesline to save the energy otherwise used during machine drying," says World Watch.
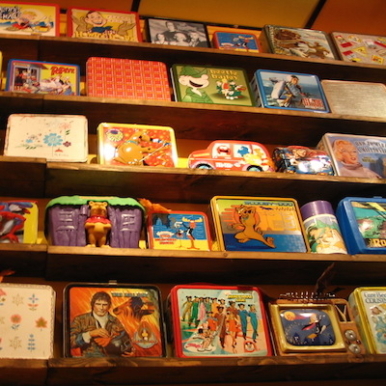
Reusable Lunch Boxes
Do you send your kids off every day with their lunch in a brown paper bag? Try using a reusable lunch box instead to cut down on waste.
Even after middle and high schoolers have grown out of using their favorite superhero lunch box, there are plenty of subtle and understated designs to complement their style.
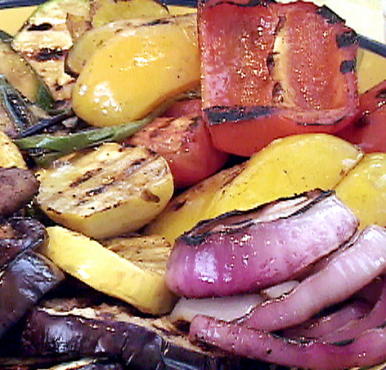
Eat Less Meat
Unbeknownst to most people, meat requires a far larger ecological footprint to produce than fruits and vegetables.
World Watch suggest adding one extra meatless meal per week.
Next time you plan a family dinner, try cooking with more vegetables and less meat.
You'll save the environment and cook a healthier meal.


