

Providence is the 3rd Worst for People with Disabilities in U.S.
Providence is the 3rd Worst for People with Disabilities in U.S.
![]()
“People with disabilities are able to play an active role in their communities, contribute to the health of a recovering economy and add diversity to the American workforce. According to the U.S. Bureau of Labor Statistics, more than five million people with disabilities were employed in 2015,” according to WalletHub.
Providence only ranks ahead of Anchorage #149 and Worcester at #150.
GET THE LATEST BREAKING NEWS HERE -- SIGN UP FOR GOLOCAL FREE DAILY EBLASTAnd, Providence ranks especially for cost of doctor visits #145 and for #146 for highest percentage of persons with disabilities living below the poverty level.
Overland, Kansas is ranked the best in the country.
SEE MAP BELOW
And, the same data show that the unemployment rate has been rising for disabled citizens, a cause for concern, considering that many such individuals rely on their jobs as a financial safety net against insufficient disability benefits.
According to the Social Security Administration, “At the beginning of 2015, Social Security paid an average monthly disability benefit of $1,165. That is barely enough to keep a beneficiary above the 2014 poverty level ($11,670 annually).” Those benefits can increase according to inflation, but such was not the case in 2016, in response to lower consumer prices in the previous year.
There is a growing employment disparity between persons with and without a disability and the additional challenges of managing a major health condition, WalletHub’s analysts compared the 150 most populated cities to determine the most disability-friendly locations in America. In order to make such a comparison, we examined each city across 25 key metrics, ranging from “number of physicians per capita” to “rate of employed people with disabilities” to “park accessibility.” Continue reading below for our findings, additional expert commentary and a full description of our methodology.
Brown Grads Leading in US Business
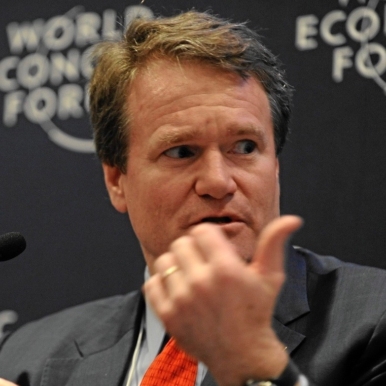
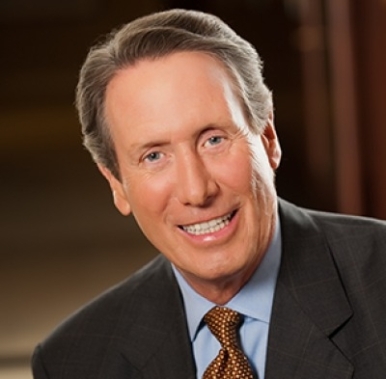
Brian Moynihan
Chairman and CEO of Bank of America
Class of 1981
Moynihan was named Bank of America’s new chairman in early October of this year, and he already has the public’s approval: barely a month later, he was selected as one of the finalists for Fortune’s “Businessperson of the Year - Reader’s Choice” for being “a performer whose vision and leadership puts them heads and shoulders above the rest.” His appointment is a bold move by the corporation as shareholders have been wary of making one person both chairman and CEO. Moynihan has been the company’s CEO since 2009, and before that held various other banking positions, as well as worked for Providence’s Edwards & Angell LLP and, then-Providence-based Fleet Bank.
Debi Coleman
Former Apple CFO
Class of 1974
Coleman established herself in the 1980’s as one of America’s top technologists when overseeing manufacturing and then serving as Chief Financial Officer at Apple under Steve Jobs (1st tenure). In the era she was arguably the top female technologist in the U.S.
She went on to established SmartForest Ventures, a venture-capital firm that helped finance start-up technology firms in the Northwest. Coleman also had executive roles with Merix and Tektronix. She has gone on to produce a number of major shows. She is an investor in GoLocal.
Jonathan Nelson
CEO and co-founder of Providence Equity Partners, LLC
Class of 1977
If you’re looking for the name “Jonathan Nelson,” you can find it in one of two places: one, on a desk nameplate at Providence Equity Partners, LLC; or two, on Brown’s new Nelson Fitness Center. Nelson is officially Rhode Island’s richest, and only, billionaire. He graduated from Brown in 1977 and didn’t have to travel far to found his own private equity firm. Today, his firm manages more than $40 billion in capital, and in 2008 Nelson was ranked #227 on Forbes’ “400 Richest Americans” list.
He is one of more than 100 billionaires that have pledged to donate half their net worth to charitable causes.
Steven Rattner
Lead adviser to Obama’s Presidential Task Force on the Auto Industry in 2009; Chairman of Willett Advisors LLC
Class of 1974
The “car czar” himself, Rattner spearheaded the Obama administration’s efforts to save the auto industry back in 2009. Rattner then went on to write a New York Times best-selling book about his experiences. Although he made major headlines through his involvement in the public sector, his work in the private one is equally as impressive: Rattner was a New York Times correspondent, a managing director at Morgan Stanley, the deputy chairman and CEO of Lazard Frères & Co., and the managing principal of Quadrangle Group LLC.
He currently serves as the chairman of Willett Advisors LLC, a firm that supervises former NYC Mayor Bloomberg’s philanthropic assets. He is a regular on “Morning Joe” on MSNBC.
George Fisher
Former CEO and chairman of Motorola and Eastman Kodak Company
Class of 1964 (M.S.) and Class of 1966 (PhD)
Two is Fisher’s magic number: he received not one, but two, degrees from Brown University, and then proceeded to become CEO and chairman of two major companies. He completed his M.S. in engineering in 1964, and received his PhD in applied mathematics two years later. Fisher then worked for Motorola for many years, and in his final year as CEO he increased sales by 22 percent. In 1993 Fisher left Motorola for Eastman Kodak Company, where he remained until 2000.
Ross Greenburg
Former President of HBO Sports
Class of 1977
His childhood heroes? Mickey Mantle and Muhammad Ali. His favorite movie? Field of Dreams. This guy lives and breathes sports. No wonder, seeing as how he spent 33 years working for HBO Sports. During this time he served as senior vice president, executive producer, and president, and has won a total of 51 Sports Emmys for his work.
Since leaving HBO, Greenburg has founded Ross Greenburg Productions, which he hopes will “stand for the same quality of programming that branded HBO Sports.”
He left in 2011, after 33 years.
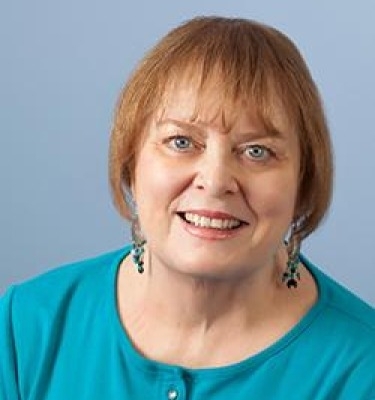
Meredith Whitney
Kenbelle Capital LP
Class of 1992
The saying goes, “If you can’t handle the heat, get out of the kitchen.” Whitney, however, proved that she could handle the heat when she was able to stand up to media scrutiny for her 2007 prediction of Citi’s impending crisis. For her accurate predictions, she was given the #2 spot on Forbes.com’s “The Best Analysts: Stock Pickers” of 2007, while Fortune called her one of the “50 Most Powerful Women in Business” and CNBC honored her as the “Power Player of the Year.” Whitney stayed strong through all the media attention, claiming, “It feels like I’m at the epicenter of the biggest financial crisis in history; however even a broken clock is right twice a day.”
Most recently, her firm Kenbelle Capital has leaped into controversy.
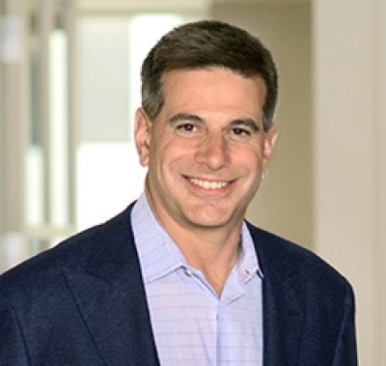
David Ebersman
Former CFO of Facebook Inc.
Class of 1991
If you’re trying to look up Ebersman on Facebook, think again. This former Facebook CFO has a private account. Ebersman served as Facebook’s CFO from 2009 to 2014, helping to take the company public in 2012. Mark Zuckerberg considered him a great partner in building Facebook” who helped the company “operate efficiently and make the long term investments we need.” Ebersman recently decided to step down from the position and intends to re-enter the health care field. If you want to know more details about his future plans, we advise you to send him a friend request.
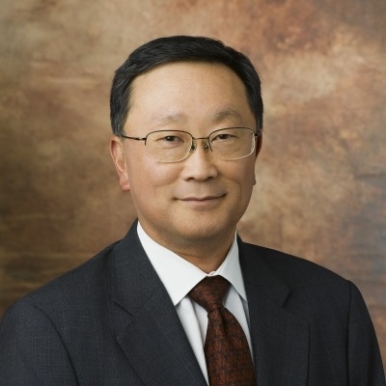
John Chen
Chairman and CEO of BlackBerry Ltd., former chairman and CEO of Sybase
Class of 1978
Chen has been described as the ultimate “turnaround artist.” After graduating from Brown in 1978, Chen took charge of Sybase Inc. after it had just suffered major financial losses. He boldly moved the company in the direction of mobile information, and things started to look up. He remembers how “People were laughing at us for getting into mobility so early ... saying there’s no money there.” A couple years later, Sybase was “the largest enterprise software provider in wireless technology.” Chen will now see if he can work his magic a second time. He was recently announced as BlackBerry’s new CEO, and he will hopefully be able to save this struggling company.
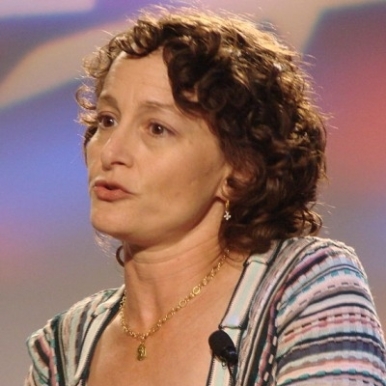
Nina Jacobson
Producer of The Hunger Games series, founder of Color Force, former president of the Buena Vista Motion Pictures Group (Disney)
Class of 1987
Jacobson has a rough job: she regularly hangs out with the likes of Jennifer Lawrence, Liam Hemsworth, and Elizabeth Banks. After graduating in 1987 with a degree in semiotics, Jacobson has gone on to produce all four movies of The Hunger Games series. She became interested in adapting The Hunger Games to the big screen after reading the book herself, claiming that she “couldn’t put it down.” Prior to producing The Hunger Games, Jacobson worked for The Walt Disney Motion Picture Group. Her film credits there include movies such as The Princess Diaries, Remember the Titans, and Pirates of the Caribbean.
http://collider.com/nina-jacobson-the-hunger-games-interview
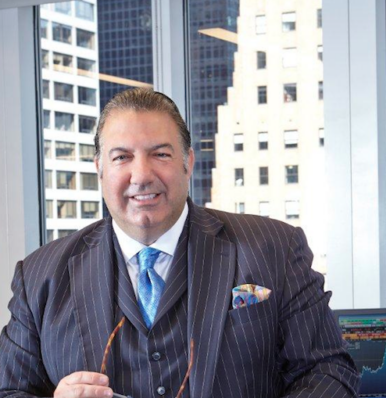
Kent Swig
President of Swig Equities, LLC and owner/co-chairman of Terra Holdings, LLC
Class of 1983
Some people say that you should major in what you want to do in life. Others, however, say you should pursue your passions, and that the rest will work itself out. Swig evidently took the latter advice, as he received a B.A. in Chinese history and from there decided to go into real estate. He currently deals with real estate in both New York City and California, as well as work with non-profit organizations such as Big Brothers/Big Sisters. He has been a bit of a lightning rod for controversy in the New York tabloids tied to some controversy with his deals and a high-profile divorce.
Tom Gardner
Co-founder and CEO of The Motley Fool
Class of 1990
On The Motley Fool webpage, Gardner’s staff bio says he “doesn’t mind it when people call him a Fool to his face. In fact, he encourages it.” Gardner co-founded The Motley Fool with his brother in 1993. He graduated from Brown in 1990 with a degree in English, and he jokes that he “has been formally trained in just about everything but finance.”
His multimedia financial-services company has been named #1 on Glassdoor’s “Best Places to Work.”
George Barrett
Chairman and CEO of Cardinal Health
Class of 1977
Barrett’s not like a regular boss, he’s the “cool” boss you never had. At this year’s Cardinal Health Retail Business Conference, Barrett rocked out on the guitar with Roger Daltrey, the lead singer of The Who. It’s not all fun and games, however, as Barrett became “one of the leaders and leading thinkers of the pharmaceutical industry” through hard work and innovation.
Cardinal Health is #21 on the Fortune 500 list, and since becoming CEO Barrett has “refocused Cardinal Health on its essential role in supporting hospitals, pharmacies, and alternative sites of care ... to improve the quality and safety of patient care.”
Barry Sternlicht
Founder, Chairman, CEO of Starwood Capital Group
Class of 1982
Everyone else on this list is a mere peasant when compared to Sternlicht, whom Fortune Magazine dubbed, “King of Hotels.” This “royal” investor graduated from Brown in 1982, and borrowed over $1 million to launch his career. The gamble paid off, however, since in addition to founding Starwood Capital Group, Sternlicht is the founder of Starwood Hotels and Resorts Worldwide, and also chairman/CEO of Starwood Property Trust.
Today, the firm manages more than $38 billion in assets.
John Sculley
Former president of PepsiCo, former CEO of Apple
Class of 1961
His autobiography is entitled, “Odyssey: From Pepsi to Apple.” The title alone shows that Sculley not only ran with the big leagues - he was the big leagues. Sculley was president of Pepsi from 1977 to 1983, and is best known as the brains behind the 1975 “Pepsi Challenge.” He left Pepsi in 1983 after Steve Jobs asked him, “Do you want to sell sugared water for the rest of your life? Or do you want to come with me and change the world?”
Today he is the co-founder of Zeta Interactive, a data-marketing firm based in New York City. And, he is an original investor in Metro PCS.

William Rhodes
Former senior vice chairman of Citigroup and Citibank, N.A.
Class of 1957
Rhodes’ road has been a long and prosperous one; he recently retired from Citibank after working there for 53 years. Rhodes began at Citi in 1957 and then worked in international financial diplomacy, negotiating agreements with countries in Latin America and the Caribbean. In 1999 he was chosen as senior vice chairman and remained in that position until he retired in 2010. He is currently a professor-at-large at Brown, where his “long career in international finance and his leadership role ... make him an invaluable resource for undergraduates, graduate students, and faculty colleagues.”
Crains listed him in 2014 as one the most connected New Yorkers.
Debra Lee
Chair and CEO of BET Networks
Class of 1976
She gets lunch with Michelle Obama. She was named one the “100 Most Influential Women in Entertainment.” And, she’s a Brown alum. Lee graduated in 1976 with a degree in political science, and since then has spent nearly 30 years with Black Entertainment Television. During this time she has helped to transform the company from a small network to the powerhouse it is today.
Lee reflects, “When I went to BET, I was so excited about working for a black-owned company that was in the media business that serves the black community ... I knew I wanted to [change the world], it was just a question of how.” Most recently, she has been inducted into the Broadcasting and Cable Hall of Fame.
John Berylson
Founder of Chestnut Hill Ventures LLC, Chairman of Millwall F.C.
Class of 1975
He’s an entrepreneur, a former Marine, and a European soccer fan. Berylson evidently has a wide range of interests, and he puts as much passion into his work as he does his sports teams. Berylson founded the private equity firm, Chestnut Hill Ventures, in 2002. Through the firm, he has owned or held major stakes in Neiman Marcus, Harcourt General, and General Cinema. He is also the chairman of the Millwall Football Club in London, and has put quite a few British pounds into ensuring the team’s success. He splits his free time between cheering for his Lions in London and the Red Sox in Boston.
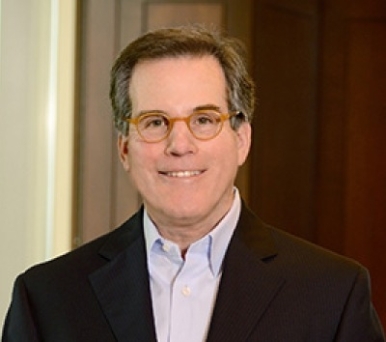
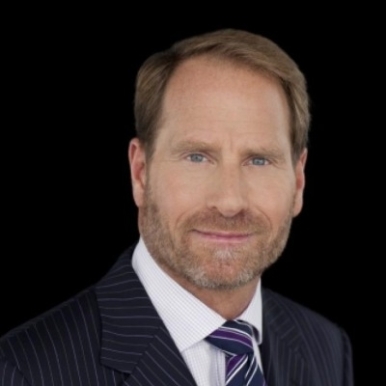
Tom Rothman
Chairman of TriStar Productions, Director of Priceline.com, former CEO and chairman of Fox Filmed Entertainment
Class of 1976
What do you do after spending 18 years in the entertainment industry, helping your company produce blockbusters like Titanic and Avatar? If you’re Tom Rothman, you take a trip. Or rather, you become director of Priceline.com, which offers discount tickets for plane tickets and hotels. Rothman graduated from Brown in 1976 with degrees in English and American literature. He joined Fox in 1994 and remained there until 2012, stating, “I’ve done the same thing, at the same place, for a long time. I do need some new challenges and to write a new chapter.” He joined joined the Priceline.com team in 2012, and he has recently launched the film and television production company, TriStar Productions, with Sony Pictures Entertainment.
He was a three-year standout in lacrosse at Brown scoring 74 goals
Glenn Creamer
Senior Managing Director of Providence Equity Partners
Class of 1984
Creamer is another key member of Providence Equity Partners team. Before Creamer teamed up with his fellow “Brown Bear” Jonathan Nelson, he served as the vice president of Narragansett Capital, and he also spent some time working for Merrill Lynch and J.P. Morgan.
He is a major donor to the Diocese of Providence.
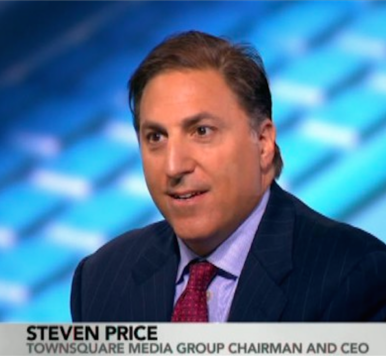
Steven Price
Co-founder, Chairman, CEO of Townsquare Media Group
Class of 1984
Since graduating from Brown, Price has played the role of investment banker, attorney, entrepreneur, government official, and CEO. In 1998 he founded LiveWire Ventures, a software and services company. Earlier in his career, Price served in the U.S. State Department as special assistant to the U.S. ambassador to the START talks and also worked in the mergers and acquisitions department of Goldman Sachs & Co.
Most recently he founded and now leads Townsquare Media Group. The company issued an IPO and raised $144 million in June of this year.
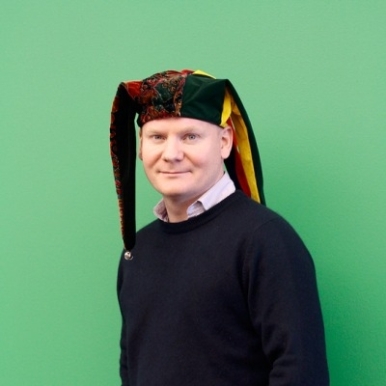
Jonathan Klein
Former President of CNN/U.S.
Class of 1980
Breaking News: The person who used to “break the news” is a Brown alum. Klein graduated in 1980 with a degree in history, and he served as CNN’s president from 2004 to 2010. Most notably, Klein was at the helm in 2008, when coverage of the Obama-McCain presidential election resulted in the highest ratings in CNN history.
Klein was GM of WBRU while at Brown. Most recently, he serves as founder/CEO of TAPP, a “TV app” that allows celebrities to connect with their fans in a more personal way.
Liz Lange
Founder of Liz Lange Maternity
Class of 1988
Lange, with a degree in comparative literature in hand, embarked on a mission to make maternity clothing “cool.” In 1997 she established her company and revolutionized the world of designer maternity wear. Since then, Lange has made major deals with Nike and Target, and her clothing has been seen on celebrities such as Reese Witherspoon and Jessica Alba.
She earned a degree in Comparative Literature while an undergrad at Brown.

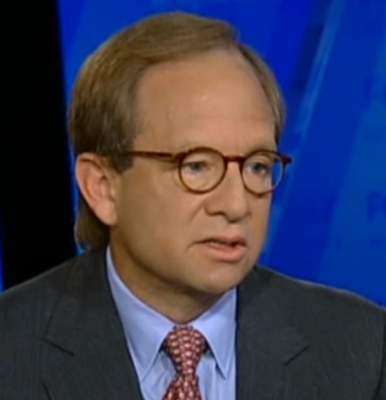
Jeffrey Greenberg
Former CEO of Marsh & McLennan; founder, CEO, chairman of Aquiline Capital Partners LLC
Class of 1973
Greenberg is simultaneously a “chip off the old block” and a “chip off the new block.” After graduation, Greenberg worked for MMC for two years before joining AIG, where his father was CEO. 17 years later Greenberg went back to Marsh & McLennan, stating “it would be fun to do something independent of AIG.”
He quickly rose through the ranks and became the company’s youngest CEO. In 2000 and 2001 Greenberg even made Forbes’ list for “America’s Most Powerful People.” Most recently, Greenberg founded and runs Aquiline Capital Partners.
Orin R. Smith
Former Chairman and CEO of Engelhard
Class of 1957
Smith worked for a company that, at its founding in 1902, literally produced gold. Although the company eventually transitioned away from precious metals in favor of minerals and chemicals, it still remained a profitable corporation. Smith became Engelhard’s vice president in 1977, president in 1984, and finally CEO in 1995. He retired from the corporation in 2001.
Lisa Caputo
Executive Vice President, Marketing and Communications, of The Travelers Companies Inc.
Class of 1986
Caputo was a member of Brown’s champion field hockey team in 1984, and she continues to channel her competitive spirit today. She currently serves as an executive for The Travelers Companies, but she also has held executive positions with Citigroup, Disney, and CBS. When working with Citi she founded Women & Co., a personal finance source for women. Caputo was a member of Brown’s Class of 1986, graduating with a B.A. in political science and French.
In 2011 she was also a recipient of the NCAA Silver Anniversary Award, which celebrates student-athletes who have managed to distinguish themselves 25 years after concluding their college athletic careers.
Dan O’Connell
Founder and CEO of Vestar Capital Partners
Class of 1976
O’Connell, and indeed his entire Vestar team, perfectly embody the “entrepreneurial spirit.” O’Connell founded the company more than 25 years ago, and he and three other founders continue to work at and expand upon the private equity firm. O’Connell graduated from Brown with a B.A. in political science.
Vestar is a diversified fund, but has been involved with many of the biggest deals in the food industry.
Paul Salem
Senior managing director of Providence Equity Partners
Class of 1985
Salem is the last, but certainly not the least, Brown alum/Providence Equity Partners businessman on this list. Not only did he help launch the firm, but he’s also responsible for bringing it into an international setting. Salem established the company’s London office in 1999 before returning to the States. Prior to working with Nelson and Creamer, Salem worked for Morgan Stanley and Prudential Investment Corporation.

Timothy Forbes
Chief strategist for Forbes Media, LLC and president of NSGV, Inc.
Class of 1976
Of course, someone named with the last name “Forbes” is on this list. Perhaps because Forbes is the list. Timothy Forbes is indeed the son of magazine publisher Malcom Forbes. After graduating from Brown, he spent a couple years as an independent producer and screenwriter, eventually joining the family company in 1986. He served as chief operating officer of Forbes Media from 1996 to 2011, and is currently the company’s chief strategist. He is also the president of NSGV, formerly known as Forbes, Inc.
John Koudounis
President & CEO of Mizuho Securities USA, Inc.
Class of 1988
Tune into Fox Business (or CNBC back in the day) and you are likely to see Koudounis appearing with Maria Bartiromo. A first-generation college grad in his family, the Chicago native played football at Brown and focused on international relations, economics and pre-med.
After Brown he did stints at Merrill Lynch and at ABN Amro,Inc. He serves as a Board member of the Hellenic Initiative to one of the boards he serves on.


