

Rhode Island's Most Disaster-Prone Communities
Stephen Beale, GoLocalProv News Contributor
Rhode Island's Most Disaster-Prone Communities
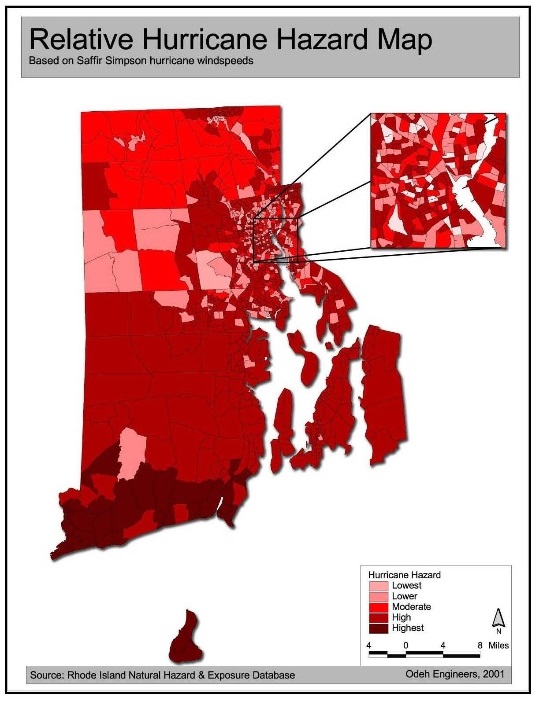
The data, contained in the 2011 State Hazard Mitigation Plan, also considers the risk and impact of several other major natural disasters, including severe winds, blizzards, and even earthquakes and tornadoes. In the plan—which has recently been updated—state emergency management officials assigned scores to each of the 39 cities and towns in Rhode Island that measure both the risk of a major natural hazard happening and how vulnerable each community is to that hazard.
Providence is most at risk and most vulnerable
GET THE LATEST BREAKING NEWS HERE -- SIGN UP FOR GOLOCAL FREE DAILY EBLASTThe numbers show that the communities that face the greatest threats from natural hazards of any kind are: Providence, Warwick, Pawtucket, Cranston, and East Providence. The results for each community are displayed in the below slides, including an overall score for that’s community’s risk and vulnerability to natural hazards.
The scores take into account both the risk posed by a natural disaster as well as the vulnerability of a community to that disaster. Risk is measured in terms of the chances of the disaster happening, as well the land area that could be impacted and how intense the disaster might be. Higher scores mean either there is a greater the chance that something might happen, that it might be more intense, or that it might affect a larger area—or all three.
Vulnerability is defined by the size and composition of the population, local economy, environmental resources, and the number of critical facilities like hospitals, schools, emergency shelter, and utilities. Communities with more residents, a larger local economy, more natural resources, a higher number of critical facilities, are more vulnerable than others.
Generally speaking, the higher the score, the more at-risk and vulnerable a particular city or town is to a natural disaster. Providence and Warwick, which are among those at the top of the list, are both larger in population size and economic activity than most other communities, and also are situated along the state coastline, putting them at a higher risk for natural disasters, such as a hurricane. (A more detailed description of the methodology precedes the slides.)
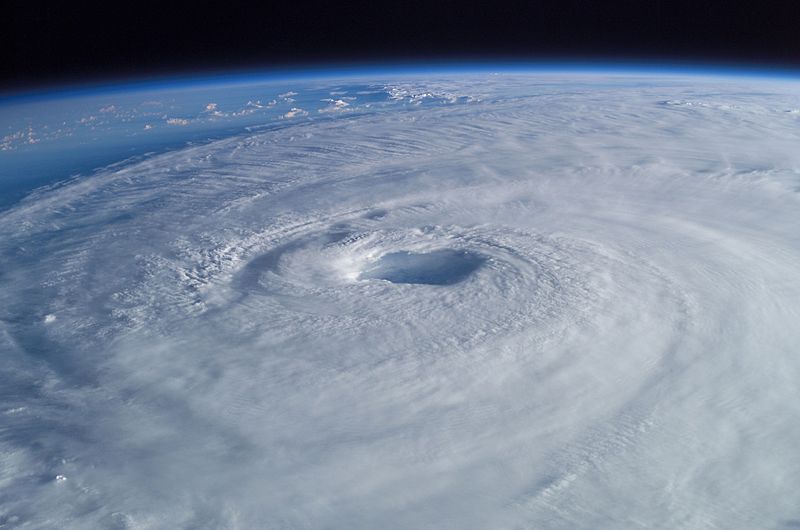
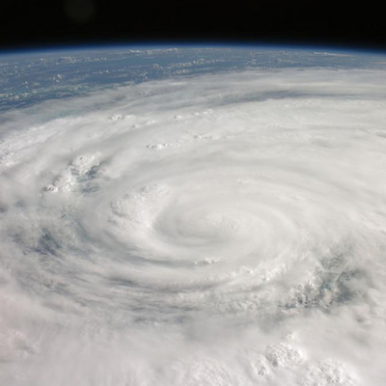
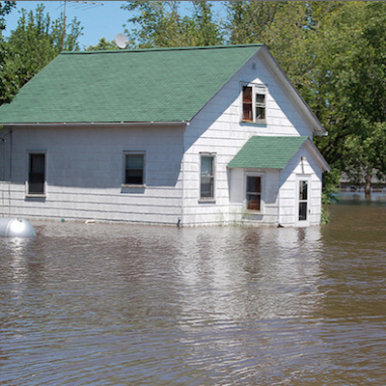
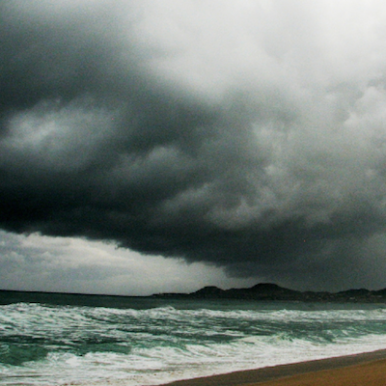
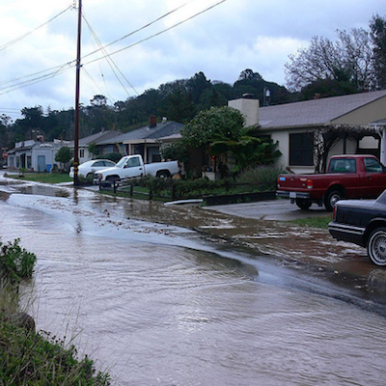
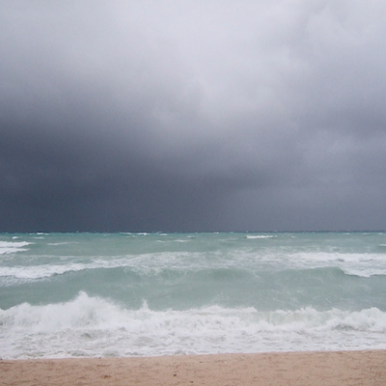
Barely more than a year after Sandy, hurricanes remain the natural disaster that Rhode Islanders worry most about—and with good reason: Sandy devastated beaches along the state’s south shore, left more than 122,000 Rhode Islanders without power, and cost the region about $62 billion. (For survey results see PDF pages 29 and 30 here.)
But Sandy was hardly the worst that could happen here, according to Janet Freedman, a coastal geologist with the Coastal Resources Management Council, a state agency that regulates coastal development and has been involved in the state’s natural hazard planning efforts. “We’ve been spared our worst-case scenario,” Freedman told GoLocalProv.
A worst-case scenario would be something like the Hurricane of 1938—an event often described as a 100-year storm, but which might be better understand as the kind of storm which has a one percent chance of happening in any given year, according to Freedman.
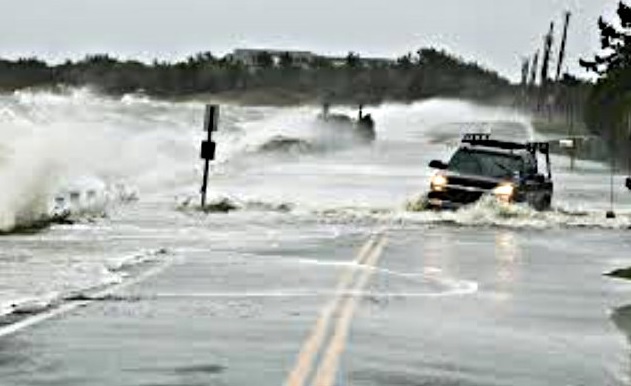
Just how much worse would a 100-year storm be? The storm surge from Sandy that devastated Misquamicut Beach swept about 1,500 feet inland in Westerly. The surge from a 100-year storm, on the other hand, would drive inland about two and a half to three times farther, slamming into Route 1A in Westerly, according to Freedman.
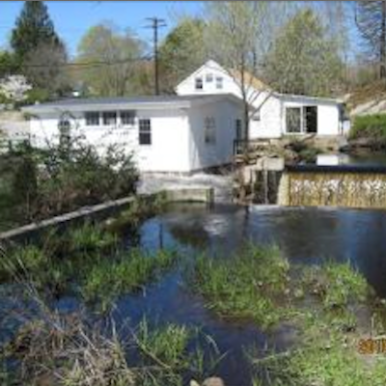
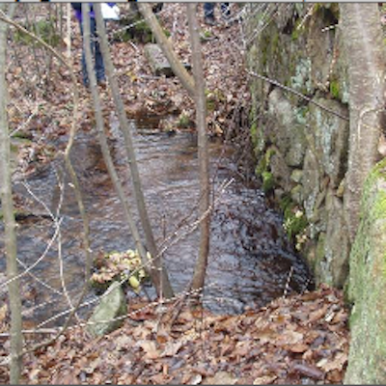
Statewide, the impact from a severe storm surge would vary, depending on elevation. When flooding from rainfall and overflowing rivers is taken into account, nearly 100,000 acres of land area—almost a sixth of the total area in the state—could be under water after a 100-year storm. A severe hurricane would put an estimated 129,962 residents at risk of evacuation and could damage more than 12,000 homes, businesses, and other buildings along the coast, state hazard planning documents show. (See below slides for a breakdown for each affected community.)
Is Rhode Island ready for a ‘100-year storm’?
“No, I don’t think so,” Freedman said.
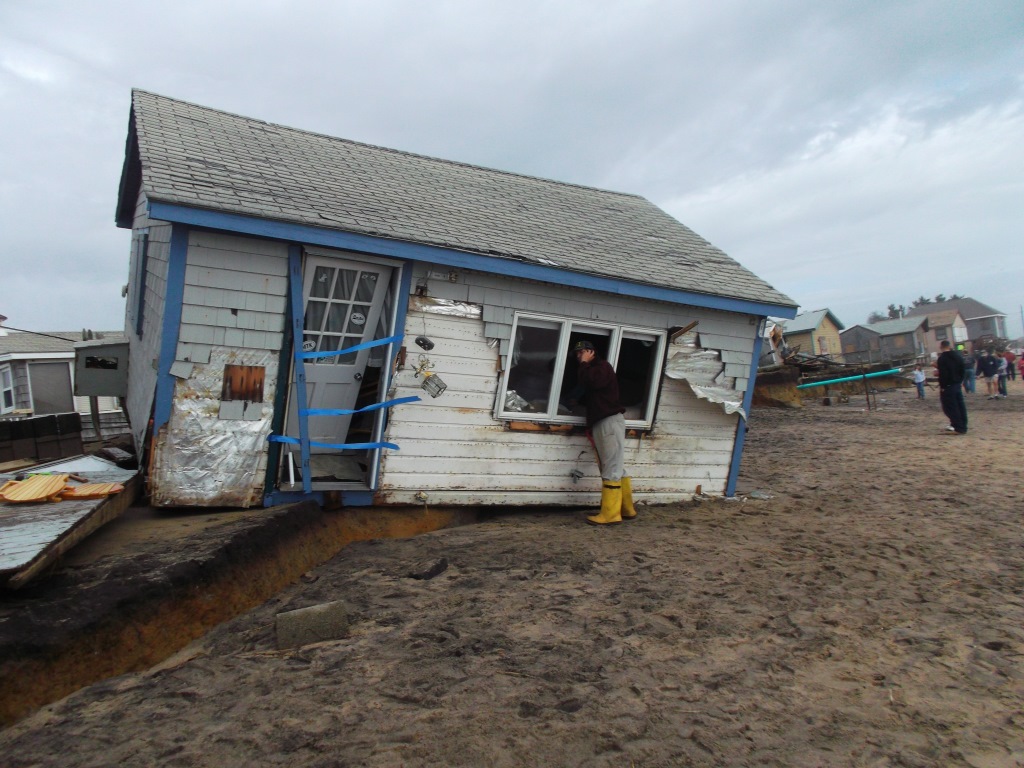
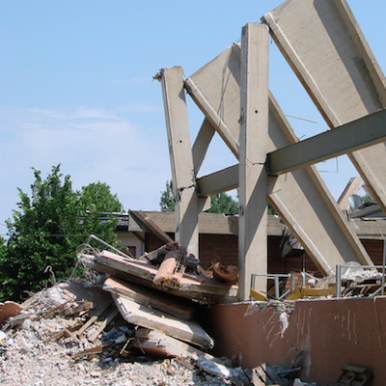
The issue, she said, is that Rhode Island has a lot of older buildings constructed before modern buildings codes were in place—like New Jersey, which, along with New York City, bore the brunt of Sandy.
Across the state, each community is bracing for the next natural disaster. In addition to the state Emergency Management Agency, each city and town has its own designated emergency management director. In some places, a fire chief or building code official does double duty. But in others, it’s a full-time job.
State and local officials have a few options when it comes to preparing for the next hurricane, Freedman said. One obvious preparation measure is ‘large-scale beach nourishment.’ More difficult is the relocation of homes that are directly in the path of the next storm surge. “They’re really hard decisions that we … as a society are going to have to make,” she said.
In general, if the cost of repairing a flood-damaged building exceeds 50 percent of the home or business value, owners must comply with a FEMA regulation mandating that they elevate their homes. In Westerly, the local emergency director said the community has been applying for FEMA grants to help fund the work. On Friday, the town announced that it had received $903,816 in federal and local grants to pay for work on eight homes.
Hundreds of buildings will likely need to be elevated above flood levels, according to Amy Grzybowski, the emergency director for Westerly whose official title is Director of Planning, Code Enforcement and Grant Administration. Many homeowners are taking the initiative and paying for the work themselves, thanks to a new federal law, the Biggert-Waters Flood Insurance Reform Act of 2012, which makes flood insurance premiums prohibitively high for owners whose homes are below flood elevation levels, she said.
Over the last year, the city has also reconstituted its Citizens Emergency Response Team, with 12 new citizen volunteers trained to help our in major disasters. Pawtucket also held a full-scale evacuation exercise at Fogarty Manor on Roosevelt Avenue and, last month, held a municipal flu clinic, according to Menard.
Rising sea levels expected to worsen disaster risk
As sea levels rise, Rhode Island’s risk from storm-related flooding will only grow, according to Freedman.
Since 1930, there has been an 8- to 10-inch rise in sea levels. The rise will accelerate over the next century. In approximately the next 25 years, levels could be about a foot higher. By mid-century, they could be about 18 inches higher, according to Freedman. Already, she said some coastal Rhode Islanders have to plan their day trips around high tides which flood roads around their homes.
The Coastal Resources Management Council in the midst of a multi-year study the impact of rising sea levels on coastal communities, Freedman said. The plan will outline how the coast will change and what measures may be necessary to protect residents of coastal communities for severe flooding in the future.
But a major 100-year storm remains a bigger threat than rising sea levels. “That’s the mosquito. The ’38 hurricane is probably the malaria. That’s the big issue,” Freedman said.
Of course, it’s not just hurricanes and winter storms that emergency planners are considering. The 2011 state natural hazard plan also eyes the possibility of an earthquake or tornado striking Rhode Island. Last week, state officials released an updated 2014 plan which also looks at wildfires and droughts.
Which of those has emergency management officials most worried? “We’re worried about everything. That’s our job,” said Armand Randolph, the public information officer for the Rhode Island Emergency Management Agency.
Rhode Islanders are most worried about hurricanes, with 60 percent saying it’s the highest threat, according to a state survey done as part of the 2014 plan. Roughly as many said tornadoes, earthquakes, droughts, and wildfires were the lowest threats.
But the Ocean State is no stranger to those natural disasters either. In the last one hundred years, 29 earthquakes have rocked Rhode Island, state records show. The most serious earthquake on record is a magnitude 4.6 earthquake whose epicenter was in North Kingstown in 1951. That damaged nearly 8,000 buildings—100 were beyond repair—and cost $1.3 billion. The last earthquake in the state for which exact figures were available was in 2012. The magnitude was 1.
There is a 50 percent probability that a “very damaging magnitude 5.0 earthquake” could hit anywhere in New England in a 50-year period, according to state officials.
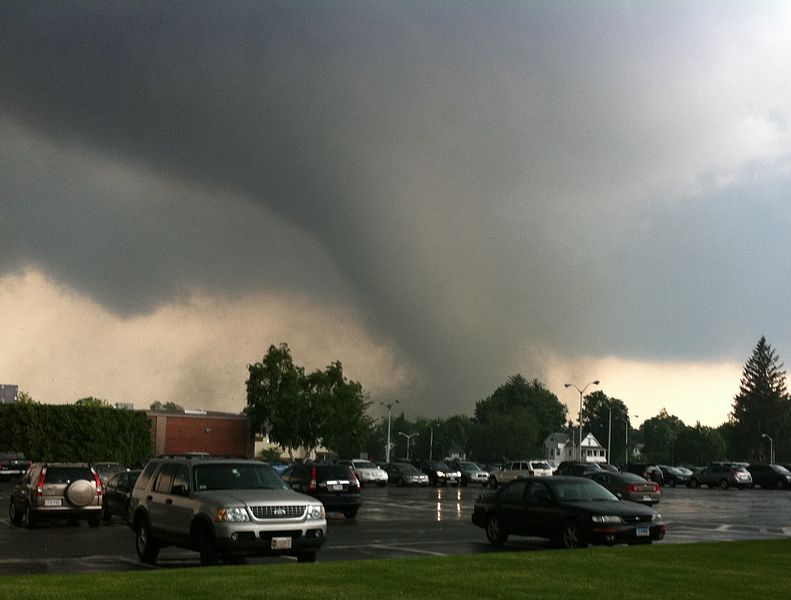
Tornadoes also are not unknown in this state. Between 1972 and 2008, ten tornadoes ripped through Rhode Island. Most were low-intensity events, with three-second wind gusts of 86 to 110 miles per hours. The total damage over that period was $3.5 million, state records show. Although tornadoes are uncommon here, state officials warn that “they may occur anytime and anywhere” and that the “situation may be more dangerous… because Rhode Island residents do not expect severe tornadoes and are ill-prepared to respond to a tornado strike.”
Droughts and major wildfires are also uncommon but a few have left their mark on state history. Between 1987 and 1988, a drought in the southern part of Rhode Island cost $25 million in crop damage. The largest wildfire on record in the state is the Coventry Fire which scorched 18,000 acres in the spring of 1942. An estimated 614 square miles—about half of the total land area of the state—are developed areas that are at risk of a wildfire because they border forests and other wild lands, according to the 2014 natural hazard mitigation plan.
Public can weigh in
The state is now just completing its federally mandated three-year update to the 2011 plan. The 2014 plan was posted in late November, in draft form online. State officials are accepting public comments on it until this Friday. Click here to view the plan and submit a comment.
Stephen Beale can be reached at sbeale@golocalprov.com. Follow him on Twitter @bealenews
Natural Disasters: RI's Most At Risk and Vulnerable Communities

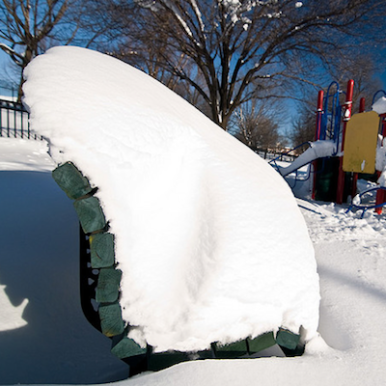
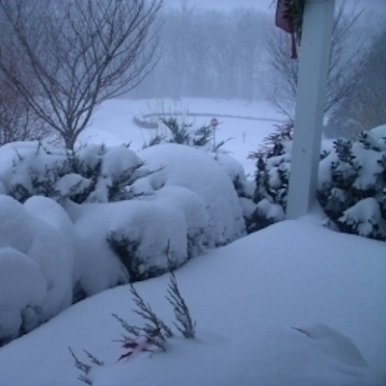
#39 Little Compton
Natural Hazard Scores
Wind Score: 160
Flood Score: 18
Earthquake Score: 60
Tornado Score: 16
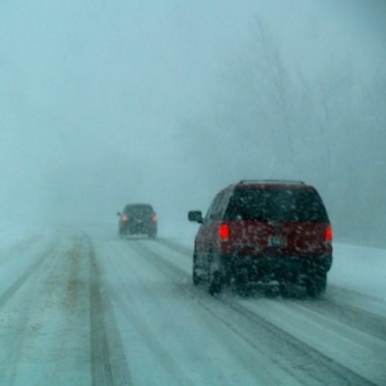
Snow Score: 50
Total Score: 424
Flood Damage
Rank: 14
Acres at Risk of Flooding: 2,516
Percent of Total Acres in Community at Risk: 16.78%
Hurricane Coastal Flooding
Number of Residents in Evac. Zone: 1,160
Number of Buildings at Risk: 187
Photo: Flickr/Al Carmadella Jr.
#38 Richmond
Natural Hazard Scores
Wind Score: 200
Flood Score: 18
Earthquake Score: 90
Tornado Score: 24
Snow Score: 75
Total Score: 587
Flood Damage
Rank: 24
Acres at Risk of Flooding: 2,945
Percent of Total Acres in Community at Risk: 11.35%
Hurricane Coastal Flooding
Number of Residents in Evac. Zone: N/A
Number of Buildings at Risk: N/A
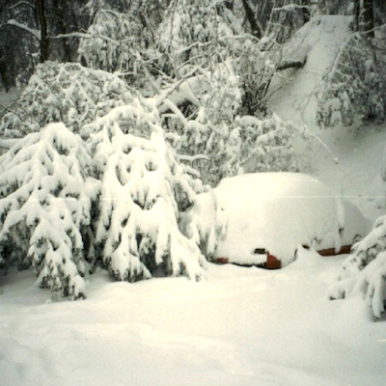
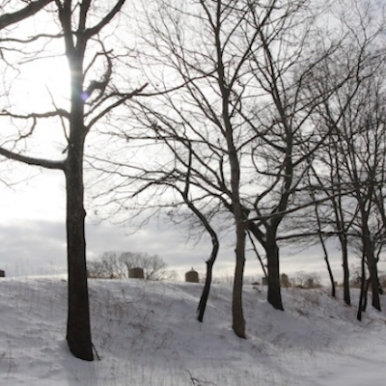
#37 Exeter
Natural Hazard Scores
Wind Score: 240
Flood Score: 0
Earthquake Score: 90
Tornado Score: 24
Snow Score: 75
Total Score: 609
Flood Damage
Rank: 36
Acres at Risk of Flooding: 2,190
Percent of Total Acres in Community at Risk: 5.78%
Hurricane Coastal Flooding
Number of Residents in Evac. Zone: N/A
Number of Buildings at Risk: N/A
Photo: Flickr/UCL Mathematical
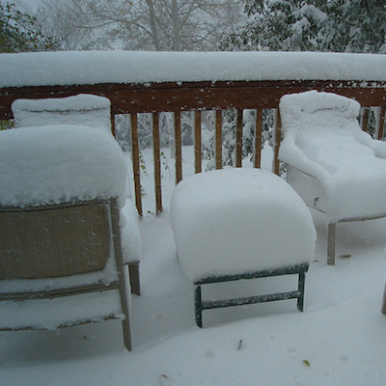
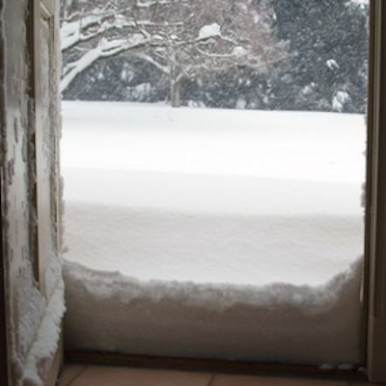
#36 West Greenwich
Natural Hazard Scores
Wind Score: 240
Flood Score: 0
Earthquake Score: 90
Tornado Score: 24
Snow Score: 75
Total Score: 609
Flood Damage
Rank: 39
Acres at Risk of Flooding: 1,197
Percent of Total Acres in Community at Risk: 3.62%
Hurricane Coastal Flooding
Number of Residents in Evac. Zone: N/A
Number of Buildings at Risk: N/A
Photo: Flickr/born1945
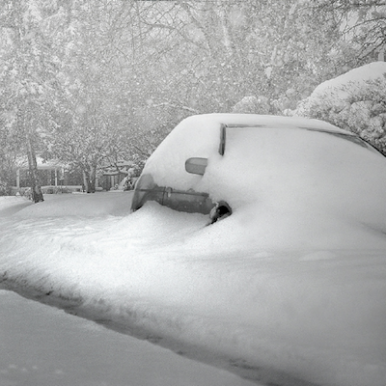
#35 New Shoreham
Natural Hazard Scores
Wind Score: 300
Flood Score: 27
Earthquake Score: 90
Tornado Score: 24
Snow Score: 75
Total Score: 696
Flood Damage
Rank: 13
Acres at Risk of Flooding: 1,220
Percent of Total Acres in Community at Risk: 17.3%
Hurricane Coastal Flooding
Number of Residents in Evac. Zone: 840
Number of Buildings at Risk: 20
Photo: Flickr/Al Camardella Jr.
.png)
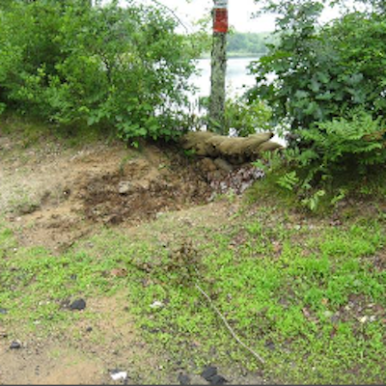
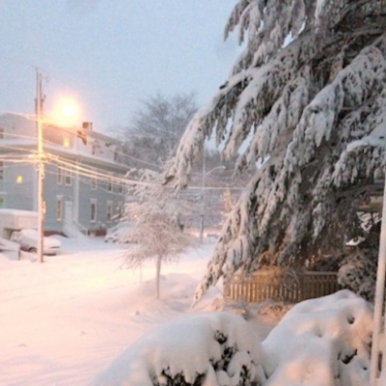
#34 Foster
Natural Hazard Scores
Wind Score: 180
Flood Score: 18
Earthquake Score: 120
Tornado Score: 32
Snow Score: 200
Total Score: 790
Flood Damage
Rank: 28
Acres at Risk of Flooding: 2,659
Percent of Total Acres in Community at Risk: 7.94%
Hurricane Coastal Flooding
Number of Residents in Evac. Zone: N/A
Number of Buildings at Risk: N/A
Photo: Flickr/US Geological Survey
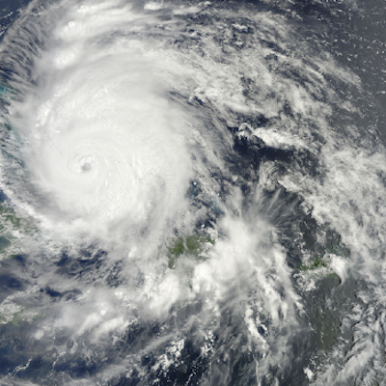
#33 Jamestown
Natural Hazard Scores
Wind Score: 480
Flood Score: 54
Earthquake Score: 180
Tornado Score: 48
Snow Score: 150
Total Score: 1,272
Flood Damage
Rank: 20
Acres at Risk of Flooding: 766
Percent of Total Acres in Community at Risk: 11.95%
Hurricane Coastal Flooding
Number of Residents in Evac. Zone: 3,910
Number of Buildings at Risk: 108
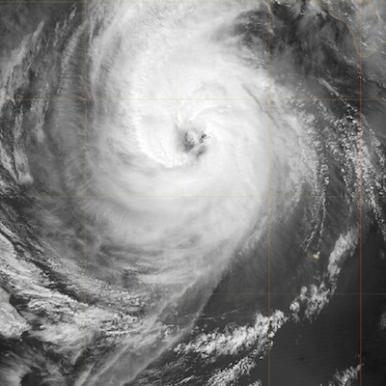
Photo: Flickr/NASA Goddard
#32 Hopkinton
Natural Hazard Scores
Wind Score: 600
Flood Score: 54
Earthquake Score: 210
Tornado Score: 56
Snow Score: 175
Total Score: 1,515
Flood Damage
Rank: 21
Acres at Risk of Flooding: 3,412
Percent of Total Acres in Community at Risk: 11.86%
Hurricane Coastal Flooding
Number of Residents in Evac. Zone: N/A
Number of Buildings at Risk: N/A
#31 North Smithfield
Natural Hazard Scores
Wind Score: 480
Flood Score: 27
Earthquake Score: 210
Tornado Score: 56
Snow Score: 350
Total Score: 1,543
Flood Damage
Rank: 26
Acres at Risk of Flooding: 1,727
Percent of Total Acres in Community at Risk: 10.63%
Hurricane Coastal Flooding
Number of Residents in Evac. Zone: N/A
Number of Buildings at Risk: N/A
Photo: Flickr/ilovemypit
.png)
#30 Charlestown
Natural Hazard Scores
Wind Score: 680
Flood Score: 144
Earthquake Score: 210
Tornado Score: 56
Snow Score: 175
Total Score: 1,685
Flood Damage
Rank: 4
Acres at Risk of Flooding: 9,276
Percent of Total Acres in Community at Risk: 34.08%
Hurricane Coastal Flooding
Number of Residents in Evac. Zone: 2,510
Number of Buildings at Risk: 838
.png)
#29 Glocester
Natural Hazard Scores
Wind Score: 500
Flood Score: 27
Earthquake Score: 240
Tornado Score: 64
Snow Score: 400
Total Score: 1,711
Flood Damage
Rank: 34
Acres at Risk of Flooding: 2,271
Percent of Total Acres in Community at Risk: 6.2%
Hurricane Coastal Flooding
Number of Residents in Evac. Zone: N/A
Number of Buildings at Risk: N/A
Photo: Flickr/Michael Dolan
#28 East Greenwich
Natural Hazard Scores
Wind Score: 720
Flood Score: 63
Earthquake Score: 270
Tornado Score: 72
Snow Score: 225
Total Score: 1,890
Flood Damage
Rank: 17
Acres at Risk of Flooding: 1,500
Percent of Total Acres in Community at Risk: 14.03%
Hurricane Coastal Flooding
Number of Residents in Evac. Zone: 1,240
Number of Buildings at Risk: N/A
Photo: Flickr/Sean Naber
#27 Scituate
Natural Hazard Scores
Wind Score: 500
Flood Score: 99
Earthquake Score: 270
Tornado Score: 72
Snow Score: 450
Total Score: 1,931
Flood Damage
Rank: 11
Acres at Risk of Flooding: 6,368
Percent of Total Acres in Community at Risk: 17.98%
Hurricane Coastal Flooding
Number of Residents in Evac. Zone: N/A
Number of Buildings at Risk: N/A
Photo: Flickr/US Geological Survey
#26 Middletown
Natural Hazard Scores
Wind Score: 800
Flood Score: 36
Earthquake Score: 300
Tornado Score: 80
Snow Score: 250
Total Score: 2,066
Flood Damage
Rank: 37
Acres at Risk of Flooding: 499
Percent of Total Acres in Community at Risk: 5.63%
Hurricane Coastal Flooding
Number of Residents in Evac. Zone: 2,012
Number of Buildings at Risk: N/A
Photo: Flickr/Ani Carrington

#25 Central Falls
Natural Hazard Scores
Wind Score: 740
Flood Score: 36
Earthquake Score: 300
Tornado Score: 80
Snow Score: 500
Total Score: 2,256
Flood Damage
Rank: 16
Acres at Risk of Flooding: 121
Percent of Total Acres in Community at Risk: 14.58%
Hurricane Coastal Flooding
Number of Residents in Evac. Zone: N/A
Number of Buildings at Risk: N/A
#24 Tiverton
Natural Hazard Scores
Wind Score: 880
Flood Score: 54
Earthquake Score: 330
Tornado Score: 88
Snow Score: 275
Total Score: 2,287
Flood Damage
Rank: 22
Acres at Risk of Flooding: 2,335
Percent of Total Acres in Community at Risk: 11.51%
Hurricane Coastal Flooding
Number of Residents in Evac. Zone: 3,080
Number of Buildings at Risk: 191
#23 Warren
Natural Hazard Scores
Wind Score: 800
Flood Score: 198
Earthquake Score: 330
Tornado Score: 88
Snow Score: 275
Total Score: 2,351
Flood Damage
Rank: 5
Acres at Risk of Flooding: 1,431
Percent of Total Acres in Community at Risk: 33.99%
Hurricane Coastal Flooding
Number of Residents in Evac. Zone: 7,520
Number of Buildings at Risk: 534
#22 Lincoln
Natural Hazard Scores
Wind Score: 740
Flood Score: 45
Earthquake Score: 360
Tornado Score: 96
Snow Score: 600
Total Score: 2,561
Flood Damage
Rank: 35
Acres at Risk of Flooding: 752
Percent of Total Acres in Community at Risk: 6.12%
Hurricane Coastal Flooding
Number of Residents in Evac. Zone: N/A
Number of Buildings at Risk: N/A
#21 Narragansett
Natural Hazard Scores
Wind Score: 1,180
Flood Score: 198
Earthquake Score: 390
Tornado Score: 104
Snow Score: 325
Total Score: 2,977
Flood Damage
Rank: 2
Acres at Risk of Flooding: 4,224
Percent of Total Acres in Community at Risk: 39.2
Hurricane Coastal Flooding
Number of Residents in Evac. Zone: 9,030
Number of Buildings at Risk: N/A
#20 Portsmouth
Natural Hazard Scores
Wind Score: 1,120
Flood Score: 216
Earthquake Score: 420
Tornado Score: 112
Snow Score: 350
Total Score: 3,058
Flood Damage
Rank: 7
Acres at Risk of Flooding: 4,238
Percent of Total Acres in Community at Risk: 26.64
Hurricane Coastal Flooding
Number of Residents in Evac. Zone: 6,530
Number of Buildings at Risk: 1,078
Photo: Flickr/Core Burn
#19 Smithfield
Natural Hazard Scores
Wind Score: 920
Flood Score: 72
Earthquake Score: 420
Tornado Score: 112
Snow Score: 700
Total Score: 3,094
Flood Damage
Rank: 30
Acres at Risk of Flooding: 1,201
Percent of Total Acres in Community at Risk: 6.74%
Hurricane Coastal Flooding
Number of Residents in Evac. Zone: N/A
Number of Buildings at Risk: N/A
#18 Barrington
Natural Hazard Scores
Wind Score: 860
Flood Score: 243
Earthquake Score: 420
Tornado Score: 112
Snow Score: 600
Total Score: 3,066
Flood Damage
Rank: 1
Acres at Risk of Flooding: 2,417
Percent of Total Acres in Community at Risk: 40.97%
Hurricane Coastal Flooding
Number of Residents in Evac. Zone: 13,890
Number of Buildings at Risk: 784
#17 Bristol
Natural Hazard Scores
Wind Score: 1,200
Flood Score: 135
Earthquake Score: 480
Tornado Score: 128
Snow Score: 400
Total Score: 3,303
Flood Damage
Rank: 8
Acres at Risk of Flooding: 1,745
Percent of Total Acres in Community at Risk: 26.28
Hurricane Coastal Flooding
Number of Residents in Evac. Zone: 5,330
Number of Buildings at Risk: 483
#16 Coventry
Natural Hazard Scores
Wind Score: 1,160
Flood Score: 81
Earthquake Score: 480
Tornado Score: 128
Snow Score: 550
Total Score: 3,359
Flood Damage
Rank: 38
Acres at Risk of Flooding: 2,147
Percent of Total Acres in Community at Risk: 5.26%
Hurricane Coastal Flooding
Number of Residents in Evac. Zone: N/A
Number of Buildings at Risk: N/A
#15 Burrillville
Natural Hazard Scores
Wind Score: 906
Flood Score: 63
Earthquake Score: 510
Tornado Score: 136
Snow Score: 850
Total Score: 3,539
Flood Damage
Rank: 32
Acres at Risk of Flooding: 2,394
Percent of Total Acres in Community at Risk: 6.39
Hurricane Coastal Flooding
Number of Residents in Evac. Zone: N/A
Number of Buildings at Risk: N/A
#14 Johnston
Natural Hazard Scores
Wind Score: 1,180
Flood Score: 18
Earthquake Score: 510
Tornado Score: 136
Snow Score: 850
Total Score: 3,714
Flood Damage
Rank: 25
Acres at Risk of Flooding: 1,677
Percent of Total Acres in Community at Risk: 10.7%
Hurricane Coastal Flooding
Number of Residents in Evac. Zone: N/A
Number of Buildings at Risk: N/A
.png)
#13 South Kingstown
Natural Hazard Scores
Wind Score: 1,580
Flood Score: 171
Earthquake Score: 540
Tornado Score: 144
Snow Score: 450
Total Score: 3,965
Flood Damage
Rank: 6
Acres at Risk of Flooding: 12,168
Percent of Total Acres in Community at Risk: 29.51
Hurricane Coastal Flooding
Number of Residents in Evac. Zone: 7,310
Number of Buildings at Risk: 1,315
#12 Cumberland
Natural Hazard Scores
Wind Score: 1,180
Flood Score: 117
Earthquake Score: 600
Tornado Score: 160
Snow Score: 1,000
Total Score: 4,257
Flood Damage
Rank: 23
Acres at Risk of Flooding: 2,098
Percent of Total Acres in Community at Risk: 11.46%
Hurricane Coastal Flooding
Number of Residents in Evac. Zone: N/A
Number of Buildings at Risk: N/A
.png)
#11 Westerly
Natural Hazard Scores
Wind Score: 1,880
Flood Score: 189
Earthquake Score: 570
Tornado Score: 152
Snow Score: 475
Total Score: 4,406
Flood Damage
Rank: 9
Acres at Risk of Flooding: 5,604
Percent of Total Acres in Community at Risk: 26.15%
Hurricane Coastal Flooding
Number of Residents in Evac. Zone: 7,120
Number of Buildings at Risk: 1,342
#10 West Warwick
Natural Hazard Scores
Wind Score: 1,480
Flood Score: 99
Earthquake Score: 660
Tornado Score: 176
Snow Score: 925
Total Score: 4,660
Flood Damage
Rank: 19
Acres at Risk of Flooding: 629
Percent of Total Acres in Community at Risk: 12.21%
Hurricane Coastal Flooding
Number of Residents in Evac. Zone: N/A
Number of Buildings at Risk: N/A
#9 North Providence
Natural Hazard Scores
Wind Score: 1,400
Flood Score: 81
Earthquake Score: 690
Tornado Score: 184
Snow Score: 1,150
Total Score: 4,885
Flood Damage
Rank: 33
Acres at Risk of Flooding: 238
Percent of Total Acres in Community at Risk: 6.3%
Hurricane Coastal Flooding
Number of Residents in Evac. Zone: N/A
Number of Buildings at Risk: N/A
#8 North Kingstown
Natural Hazard Scores
Wind Score: 1,760
Flood Score: 297
Earthquake Score: 690
Tornado Score: 184
Snow Score: 575
Total Score: 4,886
Flood Damage
Rank: 10
Acres at Risk of Flooding: 5,538
Percent of Total Acres in Community at Risk: 19.12%
Hurricane Coastal Flooding
Number of Residents in Evac. Zone: 7,820
Number of Buildings at Risk: 850
Photo: Flickr/Jessica Merz
#7 Newport
Natural Hazard Scores
Wind Score: 1,880
Flood Score: 306
Earthquake Score: 720
Tornado Score: 192
Snow Score: 600
Total Score: 5,138
Flood Damage
Rank: 3
Acres at Risk of Flooding: 2,078
Percent of Total Acres in Community at Risk: 37.24%
Hurricane Coastal Flooding
Number of Residents in Evac. Zone: 10,590
Number of Buildings at Risk: 993
Photo: Flickr/ChalkyLives

#6 Woonsocket
Natural Hazard Scores
Wind Score: 2,260
Flood Score: 99
Earthquake Score: 1,110
Tornado Score: 296
Snow Score: 1,850
Total Score: 7,835
Flood Damage
Rank: 29
Acres at Risk of Flooding: 356
Percent of Total Acres in Community at Risk: 6.95%
Hurricane Coastal Flooding
Number of Residents in Evac. Zone: N/A
Number of Buildings at Risk: N/A
#5 East Providence
Natural Hazard Scores
Wind Score: 2,720
Flood Score: 225
Earthquake Score: 1,410
Tornado Score: 376
Snow Score: 2,350
Total Score: 9,901
Flood Damage
Rank: 12
Acres at Risk of Flooding: 1,610
Percent of Total Acres in Community at Risk: 17.37%
Hurricane Coastal Flooding
Number of Residents in Evac. Zone: 7,430
Number of Buildings at Risk: N/A
#4 Cranston
Natural Hazard Scores
Wind Score: 3,820
Flood Score: 360
Earthquake Score: 1,950
Tornado Score: 520
Snow Score: 3,250
Total Score: 13,800
Flood Damage
Rank: 27
Acres at Risk of Flooding: 1,541
Percent of Total Acres in Community at Risk: 8.25%
Hurricane Coastal Flooding
Number of Residents in Evac. Zone: 2,330
Number of Buildings at Risk: 640
.png)
#3 Pawtucket
Natural Hazard Scores
Wind Score: 4,880
Flood Score: 117
Earthquake Score: 2,160
Tornado Score: 576
Snow Score: 3,600
Total Score: 15,653
Flood Damage
Rank: 31
Acres at Risk of Flooding: 392
Percent of Total Acres in Community at Risk: 6.7%
Hurricane Coastal Flooding
Number of Residents in Evac. Zone: 1,150
Number of Buildings at Risk: N/A
#2 Warwick
Natural Hazard Scores
Wind Score: 5,400
Flood Score: 684
Earthquake Score: 2,400
Tornado Score: 640
Snow Score: 2,875
Total Score: 16,799
Flood Damage
Rank: 15
Acres at Risk of Flooding: 3,923
Percent of Total Acres in Community at Risk: 16.51%
Hurricane Coastal Flooding
Number of Residents in Evac. Zone: 28,760
Number of Buildings at Risk: 2,594
#1 Providence
Natural Hazard Scores
Wind Score: 10,980
Flood Score: 486
Earthquake Score: 5,850
Tornado Score: 1,560
Snow Score: 9,750
Total Score: 40,326
Flood Damage
Rank: 18
Acres at Risk of Flooding: 1,669
Percent of Total Acres in Community at Risk: 13.58%
Hurricane Coastal Flooding
Number of Residents in Evac. Zone: 1,010
Number of Buildings at Risk: 481


.png)


.png)
.png)


.png)

.png)


.png)

