

RI Ranks Last in New England, MA Ranks #1 in U.S. in Education
GoLocalProv News Team
RI Ranks Last in New England, MA Ranks #1 in U.S. in Education
"Most parents don’t have the luxury of placing their children in exclusive, private or preparatory schools that are known for providing their students with greater individual attention," said WalletHub in a study released on Monday morning.
In New England, Massachusetts ranks #1 in the United States, New Hampshire #3, Vermont #5, Connecticut #8, and Maine #10.
GET THE LATEST BREAKING NEWS HERE -- SIGN UP FOR GOLOCAL FREE DAILY EBLAST
"For the majority of U.S. families, public education is the only option. But the quality of public school systems varies widely from state to state and is often a question of funding. Public elementary and secondary education dollars traditionally flow from three sources: the federal, state and local governments...Unlike other research that focuses primarily on academic outcomes or school finance, however, WalletHub’s analysis takes a more comprehensive approach, accounting for performance, funding, safety, class size and instructor credentials."
This study is the most critical of Rhode Island schools of a number of studies released in the past year -- in most studies RI and Maine rank similarly, but in this study Maine ranks 10th which is fifteen places higher than Rhode Island's 25th ranking.
To determine the top-performing school systems in America, WalletHub’s analysts compared the 50 states and the District of Columbia across 21 key measures. Read on for our findings, expert insight from a panel of researchers and a full description of our methodology.
In order to determine the best and worst states for public-school education, WalletHub’s analysts compared the 50 states and the District of Columbia across two key dimensions, including “Quality” and “Safety.”
We evaluated those dimensions using 21 relevant metrics, which are listed below with their corresponding weights. Each metric was graded on a 100-point scale, with a score of 100 representing the best school-system quality.
Finally, we determined each state and the District’s weighted average across all metrics to calculate its total score and used the resulting scores to rank-order our sample.
Quality – Total Points: 60
Presence of Public Schools in “Top 700 Best U.S. Schools”: Full Weight (~3.00 Points)
Note: This metric measures the number of public schools in U.S. News & World Report’s “Top 700 Best U.S. Schools” ranking adjusted by the number of public schools for each state in the U.S. News & World Report sample.
High School Graduation Rate Among Low-Income Students: Full Weight (~3.00 Points)
Dropout Rate: Double Weight (~6.00 Points)
Math Test Scores: Double Weight (~6.00 Points)
Note: This metric measures the scores earned by fourth and eighth graders.
Reading Test Scores: Double Weight (~6.00 Points)
Note: This metric measures the scores earned by fourth and eighth graders.
Share of 2016 High School Class Scoring “3” or Higher on Advanced Placement Exams: Double Weight (~6.00 Points)
Median SAT Score: Double Weight (~6.00 Points)
Median ACT Score: Double Weight (~6.00 Points)
Share of High School Graduates Who Completed ACT and/or SAT: Double Weight (~6.00 Points)
Note: For this metric, the percentage sum may be larger than 100 percent, considering some students completed both standardized tests. However, no data specifying the number of students who did so are available.
Division of SAT Results by Percentile: Full Weight (~3.00 Points)
Division of ACT Results by Percentile: Full Weight (~3.00 Points)
Pupil-Teacher Ratio: Full Weight (~3.00 Points)
Share of Licensed/Certified Public K–12 Teachers: Full Weight (~2.86 Points)
Safety – Total Points: 40
Share of Threatened/Injured High School Students : Double Weight (~8.00 Points)
Note: This metric measures the percentage of public school students in grades 9 to 12 who reported being threatened or injured with a weapon on school property.
Share of High School Students Not Attending School Due to Safety Concerns: Full Weight (~4.00 Points)
Note: This metric measures the percentage of public school students in grades 9 to 12 who reported not attending school because they felt unsafe at or on their way to or from school.
Share of High School Students with Access to Illegal Drugs: Full Weight (~4.00 Points)
Note: This metric measures the percentage of public school students in grades 9 to 12 who reported that illegal drugs were made available to them on school property.
Share of High School Students Participating in Violence: Full Weight (~4.00 Points)
Note: This metric measures the percentage of public school students in grades 9 to 12 who reported involvement in a physical fight at least once during the previous 12 months on school property.
Share of Armed High School Students: Full Weight (~4.00 Points)
Note: This metric measures the percentage of public school students in grades 9 to 12 who reported carrying a weapon on school property.
Bullying Incidence Rate: Double Weight (~8.00 Points)
Disciplinary Incidence Rate: Full Weight (~4.00 Points)
Note: Rate measured per 100,000 students.
Youth Incarceration Rate: Full Weight (~4.00 Points)
Note: Rate measured per 100,000 population aged 20 and younger.
Sources: Data used to create this ranking were collected from the U.S. Census Bureau, National Center for Educational Statistics, Centers for Disease Control and Prevention, Western Interstate Commission for Higher Education, Office of Juvenile Justice and Delinquency Prevention, U.S. News & World Report, College Board and ACT.
The Power List - Health and Education, 2016

Inside Man
Russell Carey - A name few outside of Brown’s campus know, but Carey is the power source at the Providence Ivy League institution.
Today, his title is Executive Vice President and he has had almost every title at Brown short of President. Carey is a 1991 graduate of Brown and has never left College Hill.
While Brown’s President Christine Paxson — who is functionally invisible in Rhode Island — is managing alumni affairs and fundraising, Carey is influencing almost everything in Rhode Island.
Top Raimondo Appointment
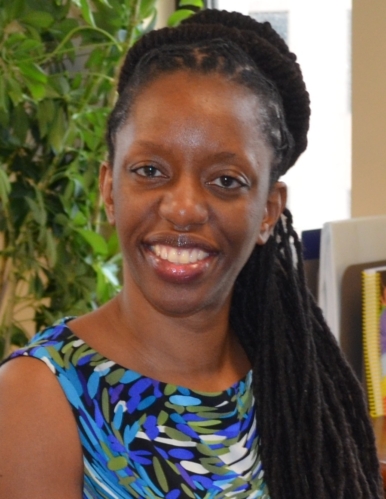
Nicole Alexander-Scott - MD, MPH, and rock star in the making. As Director of the Rhode Island Department of Health, she is fast developing a reputation as someone in the Raimondo Administration who can get things done. Her counsel and leadership on developing a strategy on opioid addiction has been widely been lauded.
In addition, she has handled the mundane - from beach closings to food recalls - with competency. An expert in infectious disease, it may be time for her to become a strong leader on Zika.

The CEO
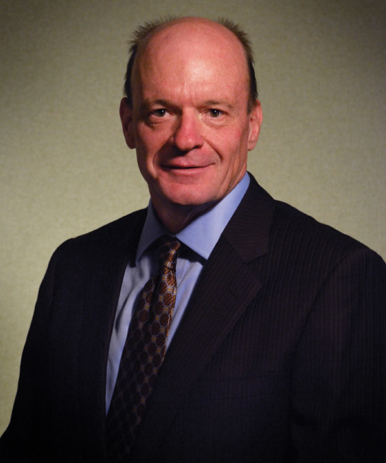
Ronald Machtley - Bryant University's President rightfully deserves to be on a lot of lists, but what few understand is that Machtley’s influence extends far beyond Bryant’s campus in Smithfield. Machtley could make this list as a business leader or as a political force as much as for education.
Machtley is recognized for transforming Bryant University from a financially struggling regional college to a university with a national reputation for business.
Machtley serves on Amica’s Board and the Rhode Island Foundation, and also serves on the Board of Fantex Brands.
Power Broker
Larry Purtill - While Bob Walsh gets the face time as the Executive Director in the media for the NEA of Rhode Island, NEARI President Purtill tends to be the inside man who gets things done.
The teachers' largest union is formidable, but is still reeling from the beat down it took when Gina Raimondo’s pension reform cut the benefits of teachers disproportionately over other employee groups.
Make no mistake about it - not much happens in education in Rhode Island without Purtill's sign-off.

Visionary
Mim Runey - While Rhode Islanders wait, and wait some more, for development on the 195 land, Johnson and Wale's University's Runey is watching it come to fruition, as JWU is set to open the first completed building on the former Interstate on September 1, when it will host a ribbon cutting for its John J. Bowen Center for Science and Innovation.
Under Runey, JWU continues to establish its foothold as one of the country's top schools for culinary training. Now Runey will oversee the addition of the new building on the old 195 which will house the university's School of Engineering and Design and its biology program.
In 2015, students from the School of Engineering & Design participated in the construction of the Holocaust Memorial on South Main Street, a collaboration between the Jewish Alliance of Greater Rhode Island and the Holocaust Education Resource Center of Rhode Island.
A true community partner in every sense, JWU under Runey's watchful eye is expanding to an even greater presence in Providence.
Chairman of the Board
Edwin J. Santos - The former banker is Chairman of the Board of CharterCare, after having been a top executive at Citizens Bank. He has been a board leader for Crossroads, Washington Trust, Rocky Hill School -- you name it and Santos has helped to lead it.
His best work to date just might be at CharterCare, where he has helped the once fledgling hospital (Roger Williams Medical Center) into a growing hospital system.

Lion Tamer
Weber Shill - He serves as the Chief Executive Officer of University Orthopedics, or in other words, dozens and dozens of oh-so-confident docs.
Shill has a background in Engineering and a Masters in Business Administration from the Whitemore School at the University of New Hampshire. Experienced in managing medical groups, but this group is big and influential.
Boss
Timothy Babineau - President and CEO of Lifespan, Rhode Island's biggest healthcare organization, where financial challenges make the job that much more complicated.
Now, the critics (GoLocalProv included) are raising concerns about the multi- billion dollar organization's refusal to make any contribution to the City of Providence. Lifespan is like General Motors, big and hard to innovate the organization.


