

The RI Communities with the Biggest Wealth Gaps
Stephen Beale, GoLocalProv News Contributor
The RI Communities with the Biggest Wealth Gaps
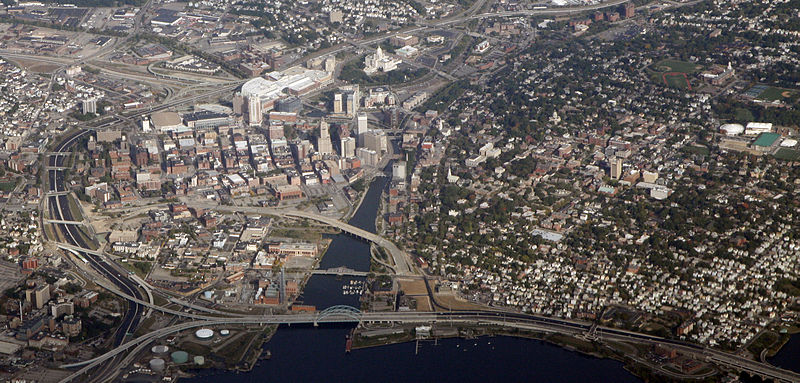
GoLocalProv pored over data for each community with a simple question in mind: What cities and towns not only have lots of wealth but also have lots of poverty? Using income figures as a rough approximation, the total number of residents who are either very well off or not well off at all was compared to how many are in the middle of the income range. Communities with more residents at the extreme ends of the income scale than in the middle are generally more economically polarized that those communities with more in the middle.
The results offer a new snapshot of local economies in Rhode Island.
GET THE LATEST BREAKING NEWS HERE -- SIGN UP FOR GOLOCAL FREE DAILY EBLASTSee the below slides for a breakdown for all 39 cities and towns.
Greatest disparities both cities and suburbs
East Greenwich ranked highest, with more than three times of residents at either the top or the bottom of the income ladder than those in the middle—also known as the median. That nearly a third of the community has household income of $150,000 or more may come as little surprise. What puts East Greenwich at the top of the ranking is the surprisingly high, at least for this community, number at the bottom and how few are in the middle. (By the numbers that’s 5.9 percent earning under $15,000 at the bottom and 11.2 percent earning around $96,438, which is what constitutes the median income in East Greenwich.)
After East Greenwich, the most economically polarized communities are, in order: Jamestown, Providence, Little Compton, and Woonsocket.
Why income inequality matters
Elected officials and policy experts across the political spectrum, in separate interviews with GoLocalProv, agreed that disparities in income are a problem. They disagreed, however, on what causes it and how best to address it.
For Luis Aponte, the president of the city council in Providence, one of the biggest problems with a large gap between wealthy and poor is the message it sends to new residents, especially immigrants who come to America seeking a better life for themselves and their children.
The history of this country, he said, is a story of migrants who started out with modest means, but by working hard—through several jobs, perhaps, or by working long hours at a small business they founded—have worked their way up, improving their circumstances or creating greater opportunities for their children, Aponte said.

There are, of course, also a number of more tangible effects as well. Greater numbers of low-income residents creates a greater demand for public services, such as housing, health care, and education. As the cost of services increases, the burden of paying for them often falls on those who can ill afford higher property taxes, the homeowners, Aponte said.
The local economy also suffers. With fewer residents who are educated, skilled, and trainable, it becomes harder to attract the economic development a city needs, according to Aponte.
“Generally speaking income inequality is problematic for society, whether at the local, national or global level. It hurts local economies when people’s purchasing power is weakened, and it makes it more difficult to achieve upward mobility,” added Kate Brewster, the executive director of the Economic Progress Institute.
Range of suggested solutions
Most efforts targeted at economic inequality tent to emanate from the federal government, not the local level, according to June Speakman, a political scientist at Roger Williams University and herself a local elected official who serves as the president of the town council in Barrington.

There’s also a social psychological factor in the sense that those funding and those benefiting from various federal programs are relatively anonymous, as contrasted with the local level. “You can’t really connect the people who are giving it with the people who are getting it,” Speakman said.
“The federal government is very good at redistributing income because the arena is so large,” she concluded.
Often communities are charged with distributing those benefits, but the money and criteria for distributing it are Washington-based. Speakman gave the example of the free and reduced lunch program in public schools.
While most efforts to combat income and wealth disparities depend on state and federal governments, cities and towns can also play a more proactive role, according to Brewster. “Cities may be able to provide some opportunities for residents to improve their economic circumstances through policies that require businesses that receive benefits from the city to hire city residents,” Brewster said.
The most prominent example of such a policy in Rhode Island is the First Source ordinance in Providence, which mandates that businesses receiving any form of aid from the city first attempt to hire local residents before going outside of the city to recruit. However, a GoLocalProv report last year found that the city had largely failed to enforce the ordinance, prompting a lawsuit from the activist group, Direct Action for Rights and Equality.
In the views of some, it’s not only government failure to act that is at issue, but also government action.

Katz pointed to taxes, licenses, and regulations as government intrusions that “make it difficult to improvise economically.”
When pressed for specific examples, Katz cited recent legislation that he said would impede the operations of small barbers and hair stylists. He also pointed to the disparity in licensing requirements for plumbers in Massachusetts and Rhode Island. Because Rhode Island has stricture requirements, fewer individuals are able to become certified as plumbers.
“That makes it more difficult for out-of-work Rhode Islanders, or just those who want the increased salaries of plumbers, to respond to market needs and make the transition,” Katz said. “Bills pop up every year that make it more difficult for individuals to attempt tasks for which they find demand without some kind of license.”
Debating inequality in Barrington
To some extent, local government does redistribute income, but usually that involves providing basic public services such as education, fire protection, and law enforcement, according to Speakman. (Presumably, redistributionism would be implied in the sense that homeowners with higher value homes are paying a larger share of local taxes.)
A state mandate requires that communities move towards having 10 percent of their housing stock as affordable. How affordable is defined varies, but it generally ranges between 60 to 120 percent of the area median income depending on factors such as family size, according to Speakman. (For Barrington, that area stretches from Providence to Fall River, which explains why the median income is so low, an estimated $43,000.)
Since the mid-2000s, local officials have been able to push Barrington from having one percent of its housing affordable to about 3.6 or 3.7 percent, according to Speakman. But the mandate remains controversial and faces resistance or hesitation on several fronts. There was a time when state and federal funding was available; now that has gone away, making the mandate an unfunded mandate for communities, according to Speakman.
It’s also a hard sell to residents who might have worked hard to climb the income ladder, only to let others in on different terms, Speakman said.
Affordable housing can even be problematic from the perspective of those who stand to gain the most from it—the residents themselves. Because affordable housing comes with 30-year deed restrictions that bar any owners from selling at market value, those new owners cannot sell at an advantage. And the same restriction would bind any children or relatives who might inherit the home, according to Speakman.
The Wealth Gap in RI Cities and Towns

39.
Hopkinton
Percent earning under $14,999: 5.0%
Percent earning over $150,000: 9.4%
Median income: $67,022
% in Median bracket: 23.6%
Inequality Score: 0.00
Score Key: Figures above 1 correspond to more inequality. Scores under 1 mean communities are more equal.

38.
Charlestown
Percent earning under $14,999: 6.0%
Percent earning over $150,000: 9.8%
Median income: $69,349
% in Median bracket:19.5%
Inequality Score: 0.81
Score Key: Figures above 1 correspond to more inequality. Scores under 1 mean communities are more equal.
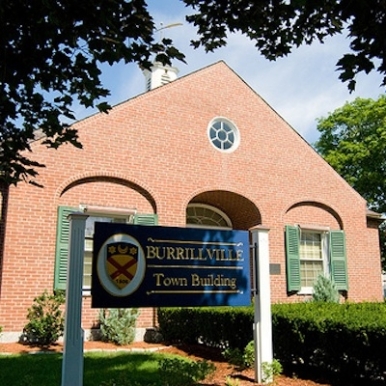
37.
Burrillville
Percent earning under $14,999: 8.1%
Percent earning over $150,000: 9.6%
Median income: $62,188
% in Median bracket: 20.7%
Inequality Score: 0.86
Score Key: Figures above 1 correspond to more inequality. Scores under 1 mean communities are more equal.
36.
Warwick
Percent earning under $14,999: 9.5%
Percent earning over $150,000: 9.1%
Median income: $62,295
% in Median bracket: 21.2%
Inequality Score: 0.88
Score Key: Figures above 1 correspond to more inequality. Scores under 1 mean communities are more equal.
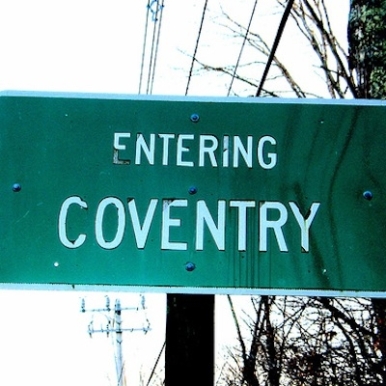
35.
Coventry
Percent earning under $14,999: 9.0%
Percent earning over: $150,000: 9.2%
Median income: $65,565
% in Median bracket: 20.1%
Inequality Score: 0.91
Score Key: Figures above 1 correspond to more inequality. Scores under 1 mean communities are more equal.

34.
Foster
Percent earning under $14,999: 4.2%
Percent earning over $150,000:17.4%
Median income: $81,651
% in Median bracket: 23.5%
Inequality Score: 0.92
Score Key: Figures above 1 correspond to more inequality. Scores under 1 mean communities are more equal.

33.
Glocester
Percent earning under $14,999: 4.8%
Percent earning over $150,000: 11.6%
Median income: $80,942
% in Median bracket: 17.7%
Inequality Score: 0.93
Score Key: Figures above 1 correspond to more inequality. Scores under 1 mean communities are more equal.

32.
North Providence
Percent earning under $14,999: 13.1%
Percent earning over $150,000: 5.8%
Median income: $51,470
% in Median bracket: 19.6%
Inequality Score: 0.96
Score Key: Figures above 1 correspond to more inequality. Scores under 1 mean communities are more equal.
31.
Westerly
Percent earning under $14,999: 7.9%
Percent earning over $150,000: 11.5%
Median income: $60,532
% in Median bracket:18.5%
Inequality Score: 1.05
Score Key: Figures above 1 correspond to more inequality. Scores under 1 mean communities are more equal.

30.
New Shoreham
Percent earning under $14,999: 3.8 %
Percent earning over $150,000: 20.7%
Median income: $90,491
% in Median bracket: 23.0%
Inequality Score: 1.07
Score Key: Figures above 1 correspond to more inequality. Scores under 1 mean communities are more equal.
29.
Warren
Percent earning under $14,999: 11.3%
Percent earning over $150,000: 9.3%
Median income: $54,295
% in Median bracket: 18.8%
Inequality Score: 1.10
Score Key: Figures above 1 correspond to more inequality. Scores under 1 mean communities are more equal.
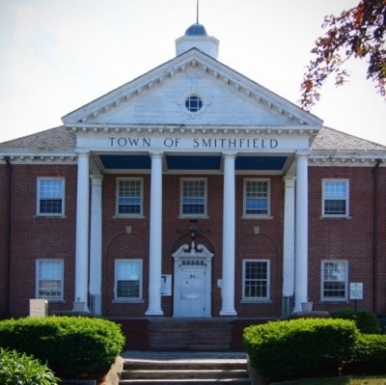
28.
Smithfield
Percent earning under $14,999: 5.2%
Percent earnng over $150,000: 16.0%
Median income: $74,000
% in Median bracket: 19.3%
Inequality Score: 1.10
Score Key: Figures above 1 correspond to more inequality. Scores under 1 mean communities are more equal.
27.
West Greenwich
Percent earning under $14,999: 2.9%
Percent earning over $150,000: 17.1%
Median income: $78,438
% in Median bracket: 18.1%
Inequality Score: 1.10
Score Key: Figures above 1 correspond to more inequality. Scores under 1 mean communities are more equal.

26.
Richmond
Percent earning under $14,999: 4.5%
Percent earning over $150,000: 20.2%
Median income: $93,975
% in Median bracket: 22.2%
Inequality Score: 1.11
Score Key: Figures above 1 correspond to more inequality. Scores under 1 mean communities are more equal.

25.
West Warwick
Percent earning under $14,999: 14.5%
Percent earning over $150,000: 4.4%
Median income: $50,590
% in Median bracket: 16.4%
Inequality Score: 1.15
Score Key: Figures above 1 correspond to more inequality. Scores under 1 mean communities are more equal.

24.
Middletown
Percent earning under $14,999: 9.2%
Percent earning over $150,000: 13.8%
Median income: $69,784
% in Median bracket: 19.3%
Inequality Score: 1.19
Score Key: Figures above 1 correspond to more inequality. Scores under 1 mean communities are more equal.
23.
Cranston
Percent earning under $14,999: 10.8%
Percent earning over $150,000: 9.6%
Median income: $60,283
% in Median bracket: 17.1%
Inequality Score: 1.19
Score Key: Figures above 1 correspond to more inequality. Scores under 1 mean communities are more equal.

22.
Tiverton
Percent earning under $14,999: 7.7%
Percent earning over $150,000: 11.6%
Median income: $73,085
% in Median bracket: 15.6%
Inequality Score: 1.24
Score Key: Figures above 1 correspond to more inequality. Scores under 1 mean communities are more equal.

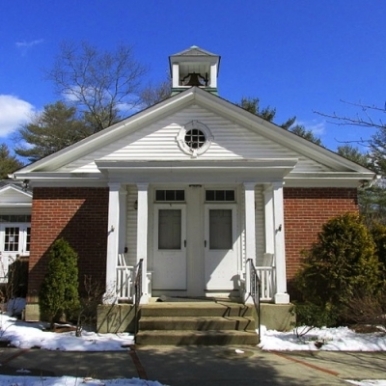
21.
North Smithfield
Percent earning under $14,999: 5.7%
Percent earning over $150,000: 15.3%
Median income: $77,378
% in Median bracket: 16.4%
Inequality Score: 1.28
Score Key: Figures above 1 correspond to more inequality. Scores under 1 mean communities are more equal.

20.
Cumberland
Percent earning under $14,999: 8.2%
Percent earning over $150,000: 14.5%
Median income: $72,160
% in Median bracket: 17.3%
Inequality Score: 1.31
Score Key: Figures above 1 correspond to more inequality. Scores under 1 mean communities are more equal.

19.
Scituate
Percent earning under $14,999: 5.7%
Percent earnng over $150,000: 16.7%
Median income: $78,980
% in Median bracket: 16.7%
Inequality Score: 1.34
Score Key: Figures above 1 correspond to more inequality. Scores under 1 mean communities are more equal.

18.
East Providence
Percent earning under $14,999: 13.2%
Percent earning over $150,000: 6.3%
Median income: $48,521
% in Median bracket: 14.2%
Inequality Score: 1.37
Score Key: Figures above 1 correspond to more inequality. Scores under 1 mean communities are more equal.

17.
Johnston
Percent earning under $14,999: 14.9%
Percent earning over $150,000: 8.6%
Median income: $56,343
% in Median bracket: 16.8%
Inequality Score: 1.40
Score Key: Figures above 1 correspond to more inequality. Scores under 1 mean communities are more equal.

16.
Newport
Percent earning under $14,999: 9.1%
Percent earning over $150,000: 15.2%
Median income: $71,713
% in Median bracket: 17.3%
Inequality Score: 1.40
Score Key: Figures above 1 correspond to more inequality. Scores under 1 mean communities are more equal.

15.
South Kingstown
Percent earning under $14,999: 5.8%
Percent earning over $150,000: 18.9%
Median income: $73,780
% in Median bracket: 17.4%
Inequaltiy Score: 1.42
Score Key: Figures above 1 correspond to more inequality. Scores under 1 mean communities are more equal.

14.
Barrington
Percent earning under $14,999: 2.7%
Percent earning over $150,000: 30.1%
Median income: $103,696
% in Median bracket: 21.8%
Inequality Score: 1.50
Score Key: Figures above 1 correspond to more inequality. Scores under 1 mean communities are more equal.
13.
Bristol
Percent earning under $14,999: 13.9%
Percent earning over $150,000: 11.9%
Median income: $62,358
% in Median bracket: 16.6%
Inequality Score: 1.55
Score Key: Figures above 1 correspond to more inequality. Scores under 1 mean communities are more equal.

12.
Narragansett
Percent earning under $14,999: 9.3%
Percent earning over $150,000: 17.2%
Median income: $66,600
% in Median bracket: 16.9%
Inequality Score: 1.57
Score Key: Figures above 1 correspond to more inequality. Scores under 1 mean communities are more equal.
11.
Exeter
Percent earning under $14,999: 6.8%
Percent earning over $150,000: 16.3%
Median income: $81,591
% in Median bracket: 14.6%
Inequality Score: 1.58
Score Key: Figures above 1 correspond to more inequality. Scores under 1 mean communities are more equal.

10.
Pawtucket
Percent earning under $14,999: 20.1%
Percent earning over $150,000: 3.7%
Median income: $40,379
% in Median bracket: 14.6%
Inequality Score: 1.63
Score Key: Figures above 1 correspond to more inequality. Scores under 1 mean communities are more equal.

9.
Lincoln
Percent earning under $14,999: 7.2%
Percent earning over $150,000: 18.1%
Median income: $72,434
% in Median bracket: 15.4%
Inequality Score: 1.64
Score Key: Figures above 1 correspond to more inequality. Scores under 1 mean communities are more equal.

8.
Portsmouth
Percent earning under $14,999: 8.6%
Percent earning over $150,000: 21.8%
Median income: $74,487
% in Median bracket: 17.9%
Inequality Score: 1.70
Score Key: Figures above 1 correspond to more inequality. Scores under 1 mean communities are more equal.

7.
Central Falls
Percent earning under $14,999: 23.2%
Percent earning over $150,000: 0.9%
Median income: $27,993
% in Median bracket: 13.7%
Inequality Score: 1.76
Score Key: Figures above 1 correspond to more inequality. Scores under 1 mean communities are more equal.
6.
North Kingstown
Percent earning under $14,999: 6.7%
Percent earning over $150,000: 20.2%
Median income: $80,530
% in Median bracket: 14.3%
Inequality Score: 1.88
Score Key: Figures above 1 correspond to more inequality. Scores under 1 mean communities are more equal.
5.
Woonsocket
Percent earning under $14,999: 23.6%
Percent earning over $150,000: 3.2%
Median income: $36,058
% in Median income: 13.2%
Inequality Score: 2.03
Score Key: Figures above 1 correspond to more inequality. Scores under 1 mean communities are more equal.

4.
Little Compton
Percent earning under $14,999: 7.2%
Percent earning over $150,000: 21.7%
Median income: $85,852
% in Median income: 13.0%
Inequality Score: 2.22
Score Key: Figures above 1 correspond to more inequality. Scores under 1 mean communities are more equal.

3.
Providence
Percent earning under $14,999: 24.6%
Percent earning over $150,000: 6.8%
Median income: $37,632
% in Median income: 12.7%
Inequality Score: 2.47
Score Key: Figures above 1 correspond to more inequality. Scores under 1 mean communities are more equal.

2.
Jamestown
Percent earning under $14,999: 8.6%
Percent earning over $150,000: 25.3%
Median income: $90,484
% in Median income: 13.2%
Inequality Score: 2.57
Score Key: Figures above 1 correspond to more inequality. Scores under 1 mean communities are more equal.
1.
East Greenwich
Percent earning under $14,999: 5.9%
Percent earning over $150,000: 33.1%
Median income: $96,438
% in Median income: 11.2%
Inequality Score: 3.48
Score Key: Figures above 1 correspond to more inequality. Scores under 1 mean communities are more equal.


