

Providence Ranked Among Worst Real-Estate Markets in U.S., Says New Study
GoLocalProv Business Team
Providence Ranked Among Worst Real-Estate Markets in U.S., Says New Study

According to a recent study completed by WalletHub, Providence is ranked 238th out of 300 ranked cities when it comes to best real-estate markets.
“Home prices and rental rates vary widely across the U.S. based on supply and demand. But if you aim for long-term growth, equity and profit, you’ll need to look beyond tangible factors, such as square footage and style. Those factors certainly drive up property values. From an investor’s standpoint, however, they hold far less significance than historical market trends and the economic health of residents,” said WalletHub.
GET THE LATEST BREAKING NEWS HERE -- SIGN UP FOR GOLOCAL FREE DAILY EBLASTProvidence’s Rankings
- 298th - Highest Maintenance Costs as % of Income
- 220th Best - Real Estate Market
- 269th Best - Affordability & Economic Environment
The Rankings
Providence ranks behind Lowell, Massachusetts and Hampton, Virginia, who rank 236th and 237th respectively.
Providence ranks ahead of Tallahassee, Florida and Waukegan, Illinois, who rank 239th and 240th respectively.
Frisco, Texas is ranked as the best real estate market in the country, while Newark, New Jersey is ranked as the worst.
See the Full Rankings in the Map Below
The Method
In order to determine the best real-estate markets, WalletHub’s analysts compared 300 cities across two key dimensions, including “Real-Estate Market” and “Affordability & Economic Environment.”
They evaluated those dimensions using 21 relevant metrics. Each metric was graded on a 100-point scale, with a score of 100 representing the healthiest housing market.
Finally, they determined each city’s weighted average across all metrics to calculate its total score and used the resulting scores to rank-order our sample.
Real-Estate Market – Total Points: 80
- Home Value Forecast: Full Weight (~5.71 Points)
- Median Home-Price Appreciation: Full Weight (~5.71 Points)
- Average Number of Days Until a House Is Sold: Full Weight (~5.71 Points)
- Share of Homes Selling for a Gain: Full Weight (~5.71 Points)
- Share of ‘Underwater’ Homes: Full Weight (~5.71 Points)
- Home Sales Turnover Rate: Full Weight (~5.71 Points)
- Ratio of Rent Price to Sale Price: Full Weight (~5.71 Points)
- Foreclosure Rate: Full Weight (~5.71 Points)
- Share of Delinquent Mortgage Holders: Full Weight (~5.71 Points)
- Number of Bank-Held Homes: Full Weight (~5.71 Points)
- Vacancy Rate: Full Weight (~5.71 Points)
- Buy vs. Rent Breakeven Horizon: Full Weight (~5.71 Points)
- Share of Young Homes: Full Weight (~5.71 Points)
- Building-Permit Activity: Full Weight (~5.71 Points)
Affordability & Economic Environment – Total Points: 20
- Housing Affordability: Double Weight (~5.00 Points)
- Maintenance Affordability: Full Weight (~2.50 Points)
- Population Growth Rate: Full Weight (~2.50 Points)
- Job Growth Rate: Full Weight (~2.50 Points)
- Unemployment Rate: Full Weight (~2.50 Points)
- Underemployment Rate: Full Weight (~2.50 Points)
- Median Credit Score: Full Weight (~2.50 Points)
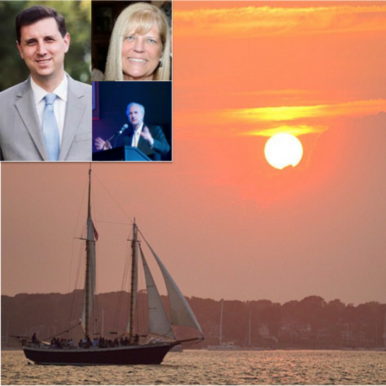
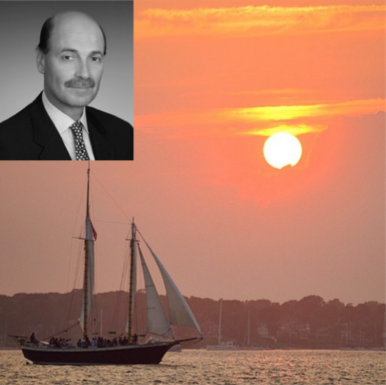
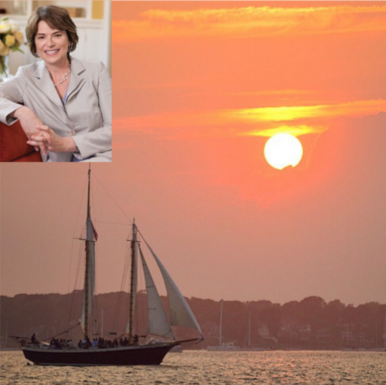
Rhode Island’s 50 Wealthiest and Most Influential - 2015 Edition
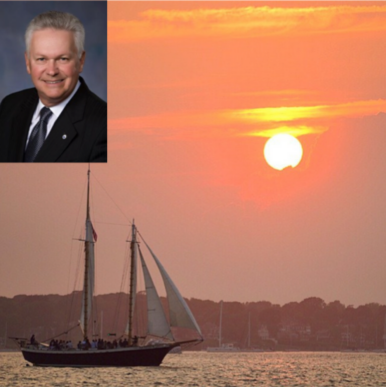
#50
Paul O’Reilly, Newport Restaurant Group
(2013 Ranking: NEW)
You may not know the name, but you have probably tasted the food. Paul O'Reilly oversees maybe the largest and most diversified restaurant group in Rhode Island. In a state loaded with great restaurateurs, O'Reilly’s collection is impressive: Castle Hill Inn; TRIO and 22 Bowen’s Wine Bar & Grille; the Mooring Seafood Kitchen & Bar; the seasonal Smokehouse Café; the Boat House; Waterman Grille; Hemenway’s Seafood Grill & Oyster Bar; and seven Papa Razzi locations.
In 2014, his Newport Harbor Corp. sold nearly 4 acres on the waterfront known as the Newport Yachting Center for tens of millions.

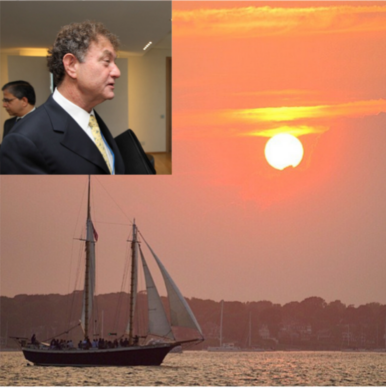
#49
Stephanie and Lincoln Chafee, Philanthropist and former Candidate for President
(2013 Ranking: 2)
No one fell more in the rankings over the past two years than the Chafees. The fall in influence was driven by an embarrassing failed campaign for the Presidency that started poorly with a focus on the metric system and went downhill from there.
Make no mistake about it, Lincoln Chafee could have been a significant force in Rhode Island and national politics at the conclusion of his term as Governor. He had close ties to the Obama White House and left the office far less scathed than former Governors like Ed DiPrete or Don Carcieri.
The Chafees stay in the rankings because of two factors. They are good at comebacks and the Chafees are wealthy, and Stephanie's side of the family (Danforths) are in the 1% of the 1%. Back in 2006, Roll Call magazine ranked Chafee as the 9th richest member of Congress.
The husband and wife team's combined wealth is estimated at between $150 million and $200 million.

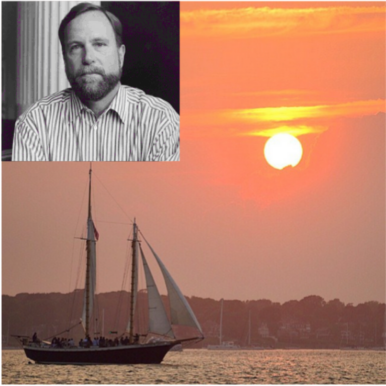
#48
Bready Family, former CEO Nortek/former CEO of Nabsys
(2013 Ranking: 10)
The Breadys - father Rick and son Barrett - are two of Rhode Island’s most ambitious and accomplished entrepreneurs. The past couple of years have been a mixed bag for the Breadys, as Barrett’s Nabsys collapsed after raising upwards of of $40+ million. It should be noted that the younger Bready had left the firm before it shuttered.
The father, Richard, hosted a major fundraiser for President Barack Obama in 2014 at his nearly $20 million mansion, named “Seafair.”
#47
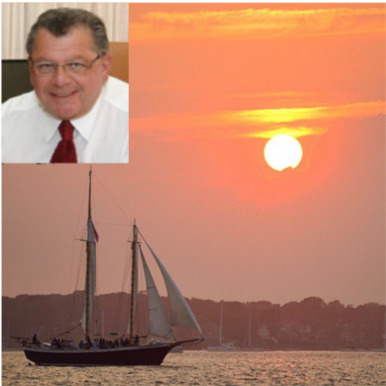
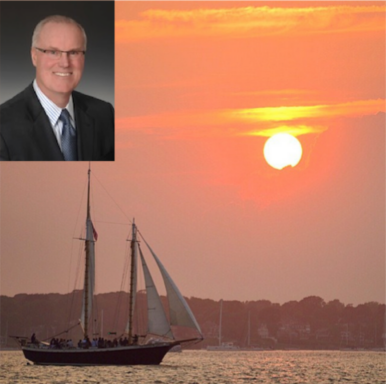
Neil Steinberg, President, Rhode Island Foundation
(2013 Ranking: 21)
Under Steinberg, the Rhode Island Foundation has been reinvented from a sleepy charity to a dynamic innovator. Not every move has worked, but their has been no shortage of effort to spark and fund improvements to Rhode Island’s quality of life and economy.
Today, the Foundation is deeply involved in the community narrative. Its peer organization — the Champlin Foundation — continues to operate in a cloak of secrecy.
The former Fleet banker was an unlikely innovator, but the Foundation is now sparking a dizzying array of initiatives. With assets pushing towards $800 million, the Foundation is the largest grant making organization in Rhode Island.
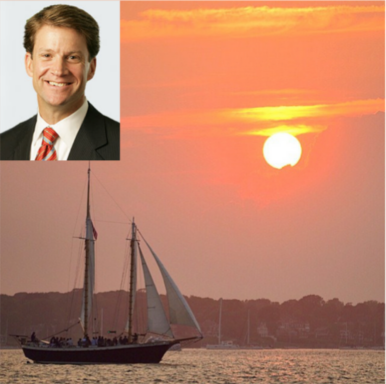
#46
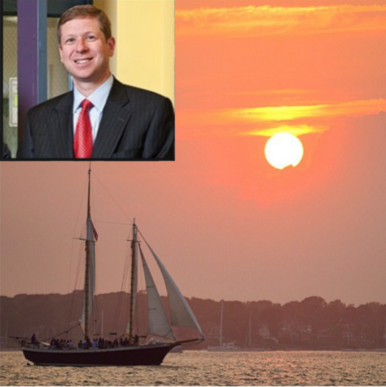
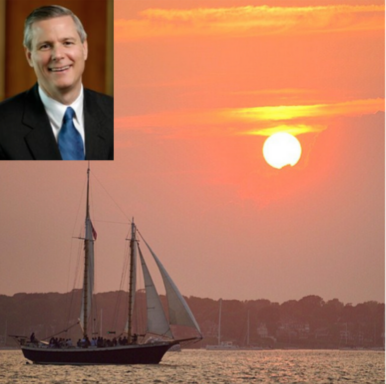
Ned Handy, President and Chief Operating Officer, Washington Trust
(2013 Ranking: NEW)
In 2013, it was a bit of a hiring coup d'état when Joe MarcAurele recruited Handy to join Washington Trust as President and Chief Operating Officer. Previously, he had 18 years at Citizens Financial Group, and was President of Citizens Bank Rhode Island and Citizens Bank Connecticut.
His Connecticut connections have been part of Washington Trust's Connecticut growth.
The Brown University graduate serves on a range of boards including Rhode Island Foundation, Crossroads Rhode Island, Delta Dental of Rhode Island, Rhode Island Hospital Foundation, Providence Foundation, Greater Providence Chamber of Commerce, Downtown Providence Parks Conservancy and Salve Regina University.
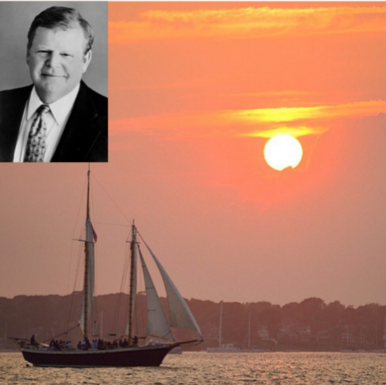
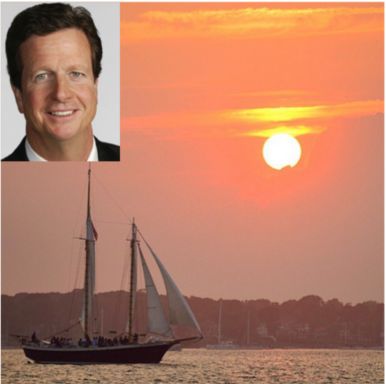
#45
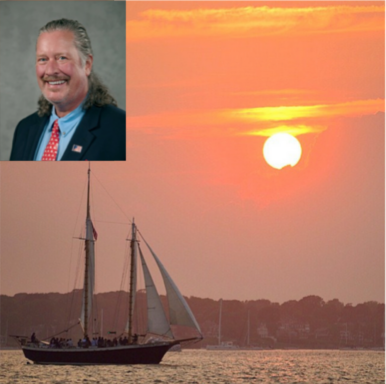
Charlie Townsend, CEO of Aloha Partners II
(2013 Ranking: 48)
Ever tap into the wireless on an airplane? The provider is almost always Gogo and Townsend is on the Board of the company. Rhode Island’s Townsend is everything wireless. He sold Aloha Partners for $2.5 billion.
Now, Townsend is the General Partner and CEO of Aloha Partners II. Aloha Partners is the 8th largest owner of wireless spectrum in the United States, and holds wireless licenses in 12 of the top 50 markets. He has served on the Board of Directors of CTIA – The Wireless Association since 1988.
Townsend is a Virginia and Harvard MBA grad.
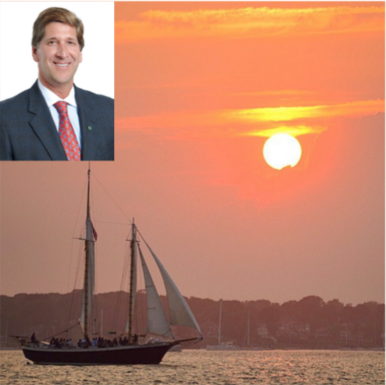
#44
Myrth York, Political Influencer, Investor
(2013 Ranking: NEW)
She was arguably the King-maker in the last two Mayoral campaigns helping both Angel Taveras and Jorge Elorza win office, but in both cases once in office she has lost influence over each of them. The three-time Democratic nominee for Governor has been the titular head of the progressive wing of the Democratic party in RI for decades.
The former State Senator from the East Side went all in for both Gina Raimondo and Jorge Elorza and she won big.
Recently, she scored an appointment to the Beacon Insurance Board as a part of a Chafee-Raimondo agreement.
York has been the Chair of the Zoning Board during the tenure of Providence Mayor Angel Taveras. The changes to zoning on Federal Hill under the York leadership of the Zoning Board have been widely scrutinized.
York is seen as a mentor to Brett Smiley, the City of Providence’s Chief Operating Officer.
#43
Mark Meiklejohn, President and CEO, BankRI
(2013 Ranking: NEW)
The bank that keeps going and growing was originally a premier regional business bank, and is now taking on all comers for consumer business.
Meiklejohn joined BankRI in January 2006 as the Director of Commercial Banking. He took over for Merrill Sherman and has changed the culture of the bank.
The former Fleet and Citizens executive has become a force in the community. He was recently the past President of the RI Bankers' Association and serves on the Boards of the United Way, Providence Chamber of Commerce, the RI Public Expenditure Council and as a Trustee for both the Providence Foundation and YMCA of Greater Providence.

#42
Jonathan Savage, Shectman Halperin Savage LLP
(2013 Ranking: NEW)
Savage and his partners have built one of the largest firms in Rhode Island. As other corporate firms have merged, paired back and shifted focus to Boston,
Shechtman Halperin Savage have staffed up and filled the void. He has built his practice on serving as receiver or Special Master on many of the biggest busts in RI: Landmark Medical Center, The City of Central Falls, LJ Crane & Rigging, Nestor Traffic Systems, Inc., American Biophysics Corporation, and Marathon Construction, Inc.
Now, as Chair of the Airport Corporation he has focused on reversing the trend of smaller and smaller annual passenger counts by bringing in new airlines, expanding the airport and upping the marketing.
#41
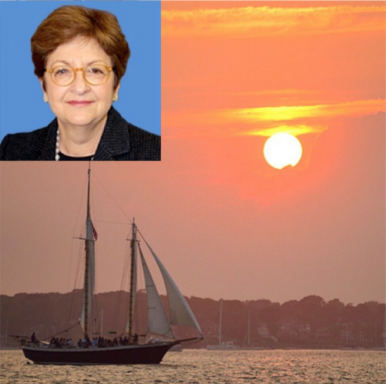
Merrill Sherman, former BankRI President and now Consultant
(2013 Ranking: 23)
Once rumored to run for Mayor of Providence and for Congress, Sherman has become a close confidant to Governor Gina Raimondo. Today, she is the Principal at Sherman Consulting and serves as special master on foreclosure cases.
She served on Raimondo’s transition team and shortly there after was appointed to Chair the Board for the multi-billion Clean Water Finance Agency.
Sherman sits on several boards including Brookline Bancorp, Inc.; Brookline Bank; Blue Cross/Blue Shield of Rhode Island and Rhode Island School of Design.
Don’t be surprised to see Sherman make a run for elected office in the future.

#40
Angus Davis, CEO and Founder of Swipely
(2013 Ranking: 46)
Davis may be Rhode Island’s most successful and experienced technologist and he not even close to hitting 40 years-old.
He founded TellMe Networks -- and sold it to Microsoft for $800 million. Now, Swipely, is pilling up the accolades. The company founded in 2009, has raised $40.5M and landed over 3,000 customers.
Combined the company has "sales under management" of over $4 Billion
He has been tapped for most every tech award by Forbes and Fortune - a big win by Swipely would be a big win for Rhode Island.
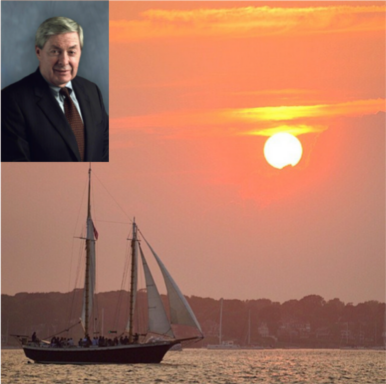
#39
Paul Choquette Jr., Vice Chair, Gilbane, Inc.
(2013 Ranking: 19)
Like family member Tom Gilbane #38, their is no decay in influence, but the engagement in Rhode Island has diminished. Choquette has served on most every major board including Lifespan, the Brown Corporation, Trinity, and the RI Economic Development Corporation. It is the latter of those appointments and the vote for 38 Studios loan guarantee that is the blemish.
He was a football star at Brown, and legal counsel to then-Governor John Chafee in the early 1960s.
But, make not mistake about it, the family's wealth and the company's influence has only increased, it's just their desire to play in the Rhode Island “sandbox” has decreased.

#38
Tom Gilbane, Jr., CEO and Chairman, Gilbane, Inc.
(2013 Ranking: 33)
The Gilbane family’s wealth and influence is growing, but the company’s move to Boston has made the them more and more a regional and national player.
Gilbane and Paul Choquette have been two of the leaders in growing Gilbane from a strong regional construction force to a national firm over the past four decades.
In 2014, when GoLocal ranked the 9 wealthiest families in New England, the Gilbanes came in at #7 based on Forbes Data: With a net worth of $1.4 Billion, the family is ranked as the #147 wealthiest family in America.
#37
Richard Baccari, Churchill and Banks
(2013 Ranking: NEW)
Baccari has had a tumultuous couple of years. The mega-developer has put together a massive collection of successful projects throughout the region, but not without great effort and some pain.
In 2014, he was cleared of Federal conspiracy and bribery charges relating to the North Providence Municipal corruption probe.
In early 2015, Baccari announced that he would be handing over the reins to the development company to his son, Richard, Jr.
The portfolio of retail, office, residential and commercial are many of the best known properties around the region. He continues to be a major force in Rhode Island.
#36
Mark Pelson, PCI Private Equity
(2013 Ranking: 44)
Pelson is a quiet leader in business and politics. His relationship with the infrastructure of private equity in the state and his close relationship with Governor Gina Raimondo puts Pelson in a unique power position. He served on Raimondo’s transition team.
He has served as Chairman of Lambert's Cove Acquisition Corporation since its inception. He is a partner in several Providence Equity funds where he has served on numerous corporate boards.
Pelson has served on the Board of Overseers of Children's Hospital Boston and as Chairman of The Wolf School in East Providence.
#35
Donald Sweitzer, Chairman, IGT Corporation (formerly GTECH)
(2013 Ranking: NEW)
There is the outside game and the inside game, and Sweitzer is very good at the inside game. In a company that has changed CEO a number of times, moved headquarters, been acquired by an international concern and rebranded, he continues to play his roll as top political adviser to the global gaming company.
Sweitzer is an “ambassador for the Company when interacting with global customers, current and potential partners, and government officials,” says his corporate bio. Additionally, Sweitzer advises IGT's CEO on government affairs and general business matters.
Prior to joining GTECH way back in 1998, he was a national Democratic consultant.
#34
Michael Mahoney, CEO Boston Scientific
(2013 Ranking: 26)
It has been a good couple of years for the Rhode Islander and CEO of Boston Scientific. The once volatile medical device firm has seen a far steadier path under Mahoney’s leadership.
Boston Scientific recorded $7.3 billion in sales in 2014. As President and Chief Executive Officer, Mahoney made $10,329,264 in total compensation. Of this total $921,302 was received as a salary, $1,404,150 was received as a bonus, $1,899,718 was received in stock options, $6,044,228 was awarded as stock and $59,866 came from other types of compensation, according to Salary.com.
#33
Magaziner Family, State Treasurer, Clinton Foundation, Philanthropists
(2013 Ranking: 31)
Seth Magaziner is the General Treasurer of RI; his father, Ira, is the vice chairman and chief executive officer of the Clinton Health Access Initiative; and his mother, Suzanne, chairs the Board of Trinity Rep.
The younger has pledged to create a higher level of transparency as he manages the more than $7 billion dollar state pension system. The management of the assets has been widely criticized for the lack of disclosure tied to payment of massive fees to hedge funds. Ira Magaziner who has had a storied career as a business consultant and as an advisor to the Clintons, but it has not been without controversy. Most recently, a New York Times article was scathing regarding his performance at the Clinton Foundation.
Combined, the Magaziner family touches most every component of Rhode Island life and play at a national level as well. A Hillary Clinton Administration could mean more big things for anyone of the three.
#32
Brian Goldner, CEO, Hasbro
(2013 Ranking: 32)
Goldner may have changed Hasbro more in the past five years than the company changed in the previous 50 years. He transformed the company from a manufacturing based toy company into an multi-media, entertainment company. It looks a lot more like EA sports than it does like the old Milton Bradley subsidiary. The move of a division and workers to Providence has been part of the transition of the company.
The reinvention he has implemented is dubbed as “Hasbro's branded-play strategy through the global re-imagination, re-invention and re-ignition of Hasbro's world-class brand portfolio.”
As President and Chief Executive Officer at Hasbro, Goldner made $14,437,987 in total compensation. Of this total $1,300,000 was received as a salary, $2,300,000 was received as a bonus, $2,798,372 was received in stock options, $7,741,677 was awarded as stock and $297,938 came from other types of compensation, according to Salary.com.
#31
Terry Murray, Former CEO of Fleet Bank
(2013 Ranking: 36)
Murray loves baseball. When CEO at Fleet he signed a massive sponsorship deal with Major League Baseball. Murray’s passion about the sport put him back in the public eye when he joined the new ownership group that purchased the PawSox from the Mondor family. He along with two other members of the list - Habib Gorgi and Tom Ryan — came under public scrutiny when they asked for more than $120 million in public financing.
Murray grew up in Woonsocket, attended Harvard, and then grew and merged Fleet Bank from a regional to global player.
He orchestrated the merger between Bank Boston and the Fleet Boston to became the 7th largest lender in America before being bought by Bank of America.
He is one of two Rhode Islanders who belong to Augusta National.
#30
Bruce Van Saun, Chairman and Chief Executive Officer, Citizens Bank
(2013 Ranking: NEW)
No one may determine the future of Providence more than Van Saun. The CEO of Citizens has navigated the company's spin away from the Royal Bank of Scotland and its public offering.
Now, he will set the course for the future of the city and his bank. 4,000 employees in downtown Providence would be great for the city, state and carbon foot print -- instead of thousands of cars driving to Smithfield.
He is a behind the scenes “data guy” and for Citizens to compete and grow the company will need to recruit smart technologists —and they don’t want to be working at a campus in the burbs.
Van Saun has held a number of top jobs with Bank of New York and later Bank of New York Mellon, including Vice Chairman and Chief Financial Officer. He is a director of Lloyd’s of London.
A Van Saun move to Providence and redevelopment of a downtown campus with the Superman building is a game changer for Rhode Island - they build statutes for people with that kind of vision.
#29
John Bowen, Chancellor, President, and CEO of Johnson and Wales
(2013 Ranking: NEW)
Johnson and Wales continues its metamorphosis. Bowen is by far the longest serving college President having been appointed in 2004.
He oversees more than 17,000 students and approximately 2,000 employees at campuses around the country: Providence; North Miami, Fla.; Denver, Colo.; and Charlotte, N.C.
The University's growth has been significant and transformational in downtown Providence.
He has been a Director at Washington Trust, as a Director for Newport Harbor Corporation and was Chairman of the Providence Foundation.
#28
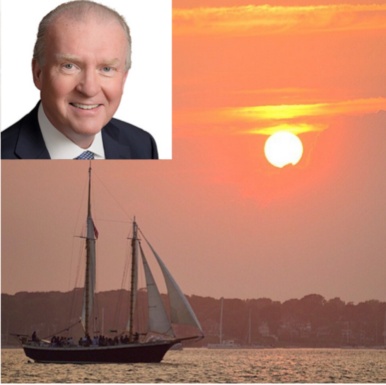
Joe MarcAurele, Chairman and Chief Executive Officer, Washington Trust
(2013 Ranking: 24)
MarcAurele has helped to grow Washington Trust into a major banking player in Rhode Island and now with a major focus on growth in Connecticut.
He started his career at Fleet and had a major stint at Citizens but jumped to take over the Presidency of Washington Trust in 2009.
He has served as President of the Rhode Island Community Food Bank and a trustee of the Greater Providence Chamber of Commerce, and Rhode Island Hospital Foundation.
MarcAurele received an Honorary Degree of Business Administration in Financial Services Management from Johnson and Wales University and an Honorary Doctorate of Business from Bryant University.
As Chairman and Chief Executive Officer of Washington Trust, he made $1,134,661 in total compensation. Of this total $514,596 was received as a salary, $318,407 was received as a bonus, $208,653 was awarded as stock and $93,005 came from other types of compensation, according to Salary.com.
#27
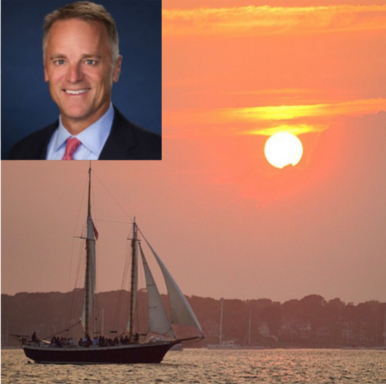
John Hazen White, CEO Taco
(2013 Ranking: NEW)
The third-generation CEO of one of Rhode Island’s most successful and enduring manufacturing companies has demonstrated skills at both corporate leadership and political disruption. Never shy, Hazen White has been a loud voice in funding efforts to reform issues in Rhode Island, including pension reform, master level and a failed effort to adopt a Constitutional Convention.
Taco has made a number of global acquisitions and entered into a series of strategic partnerships. He is the principal funding source for the Hummel Report and has endowed the John Hazen White Forum on Public Policy at the Brookings.
The reach of his philanthropy targets many education and cultural efforts in Rhode Island, with annual gifts totaling a little more than $400,000.
#26
Robert DiMuccio, CEO Amica Insurance
(2013 Ranking: NEW)
There is not a Rhode Island CEO who is more connected to the community than DiMuccio. Whether it is the Boy Scouts or the NAACP, he is usually there picking up a well-deserved award for contribution to the community.
Amica which has grown from a small mutual insurance company in which you needed to get a reference in order to join back in the 1970’s, to now a national power - nearly always winning top ranking for quality and customer service.
In April of this year, DiMuccio was featured in a Forbes piece, “In Search of Building a Great Company." The publication wrote, “Since 2005, when Bob became CEO of the 108-year-old mutual company, Amica has won a remarkable 29 J.D. Power awards.”
He serves on a range of Boards including Washington Trust’s.
#25
Frederick Butler, Chair of the Board of RI Foundation
(2013 Ranking: NEW)
Butler may be on more high profile and influential boards then any other Rhode Islander. The former top level executive at Textron is now the Chair of the Board at the Rhode Island Foundation.
He is chairman of AAA Southern New England’s board of directors, a commissioner of the Rhode Island Ethics Commission and a trustee of Salve Regina University. He is vice chairman of the board of directors for Delta Dental of Rhode Island, a past chairman of The Providence Foundation, and a former board member of the United Way of Rhode Island.
Butler is a graduate of Harvard University and Harvard Law School. He worked at Textron in various legal and executive positions from 1980 until his retirement in 2009, and has held numerous leadership positions in Rhode Island, including chairing the Providence Foundation and the board of FirstWorks Providence. Butler is a commissioner of the Rhode Island Ethics Commission and a trustee of Salve Regina University.
#24
Thomas Tisch, Chancellor, Brown University
(2013 Ranking: 29)
As Brown's influence is getting bigger and broader in Rhode Island, so does Thomas Tisch's in Rhode Island.
His wealth would be significantly higher, but as a member of the Sears Board he bet big on the performance of the company. According to a Barron’s April of 2014 story, Tisch purchased 475,000 shares of Sears’ stock for $15,940,000 at $33.50 a share.
That increased his holdings to 620,824 shares plus another 933,478 shares in a trust. The value of his Sears holdings have decrease from $52 million to about $30 million.
Already a powerful financier from one of America's most influential families, he is managing partner of Four Partners, an investment firm in NYC.
In addition to serving on the Sears board, he serves on the boards of directors of kgb inc. Additionally he serves on the boards of trustees for the New York University Langone Medical Center and KIPP New York.
Editor's Note: an earlier version misidentified him at Provost, we apologize for the error. The Provost is Richard Locke.
#23
Charles Royce, Royce Funds/Ocean House/Weekapaug Inn
(2013 Ranking: 38)
The billionaire Royce has made a profound impact on Rhode Island’s hospitality industry by restoring and dramatically enhancing two of the most historic and unique Victorian properties in the state. He has invested tens of millions in developing the Ocean House in Westerly and the Weekapaug Inn into brimming expressions of Victorian architecture.
Royce holds a bachelor's degree from Brown University and a Masters of Business Administration from Columbia University. He has been a major donor to Brown and funds the Royce Fellowship at Brown.
#22
Bernie Buonanno, III, Managing Partner at Nautic Partners
(2013 Ranking: NEW)
An accomplished private equity financier — he and Habib Gorgi (#15 on the list) have built their once spinoff from Fleet Bank boutique into a billion dollar concern. The connections with others in the power structure in Rhode Island is a veritable family tree.
His sister Helena Foulkes is #5 on the list, his father is the chair of the Convention Center Authority and Helena’s husband (Bill Foulkes) serves on the state’s Board of Education.
Buonanno was an all-Ivy lacrosse player at Brown. His uncle was U.S. Senator Christopher Dodd (D-CT).
#21
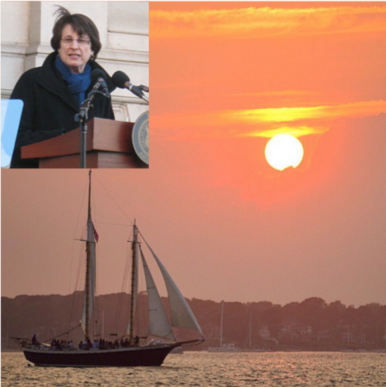
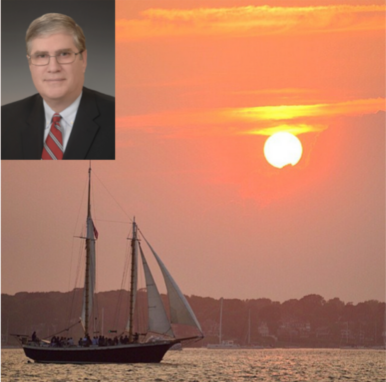
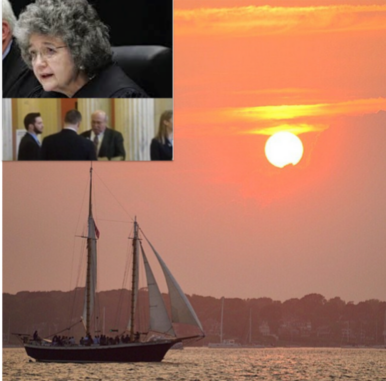
Maureen McKenna Goldberg and Robert Goldberg, Supreme Court and Lobbyist (respectively)
(2013 Ranking: 13)
Meet the highest ranked power couple on the list. In a list dominated by millionaires and even billionaires, the Goldbergs are certainly wealthy, but the strength of their ranking comes from their combined influence.
Maureen McKenna Goldberg has served on the Rhode Island Supreme Court for more than 15 years.
Her husband, Robert Goldberg is the top lobbyist in Rhode Island -- his clients are a who's who of RI and US corporate America, including CVS, FedEx, Johnson and Wales, Bryant University and GTECH. It is reported that Goldberg earns an estimated $1 million plus per year in lobbying and associated legal work.
The chink in the political armor for Bob Goldberg came this year when what was thought to be a slam dunk project - the move of the PawSox - got stopped by a group of citizens, a lot of social media and investigative reporting.
#20
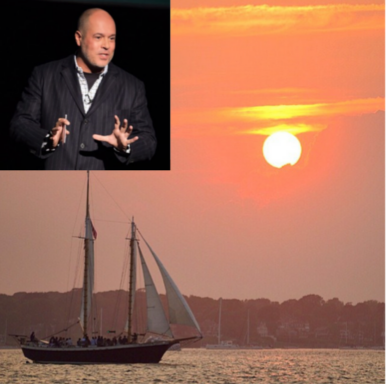
Giovanni Feroce, CEO of BENRUS
(2013 Ranking: 6 with Carolyn Rafaelian)
Giovanni Feroce is trying to do it twice. His success at Alex and Ani has him recognized as one of today’s most successful American CEOs, and now he is in the midst of building BENRUS into a multi-billion dollar. The military-inspired lifestyle brand is growing from a WWII watch brand into a complete lifestyle brand.
Feroce currently serves as CEO and Chairman of BENRUS, LLC. and in just a year has rebranded and expanded the company, inked a major deal with Nordstrom, and opened retail locations on the East Coast.
As the New York Times wrote, "Mr. Feroce is in the midst of bringing it back to market. His goal is to transform Benrus into a lifestyle brand — selling things like backpacks, bomber jackets, even a men’s cologne called Benrus Black, a reference to “black ops” — with the watches taking center stage."
If he hits a homer with BENRUS, he will have done what few CEOs have ever done — taken two companies on upward rocket rides.
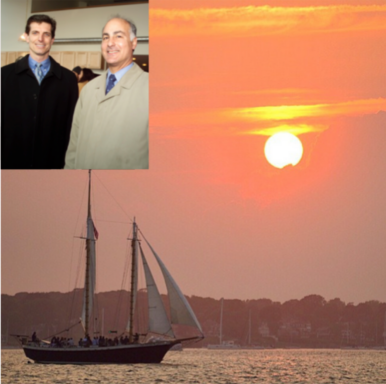
#19
Tom Guerra and Tony Thomas, Foundry Complex
(2013 Ranking: 41)
The son and son-in-law of architect and developer Antonio Guerra now manage the amazing rehabbed industrial campus. The elder Guerra passed in 2014, but he had purchased the then-mothballed Brown and Sharpe complex from the company in the late 1960's. Over 40 years, the family painstakingly rehabbed each building and developed it into the premier work-live complex in the state.
The campus offers 26-acres and 13 buildings and is listed on the National Register of Historic Places.
In 2013, they acquired American Locomotive Complex for just under $20 million and just completed the redevelopment of the “Sharpe” Building into additional apartments.
Now, thousands work in their buildings and hundreds live in the former mills.
Combined, these real estate holdings exceed an estimated $300 million.

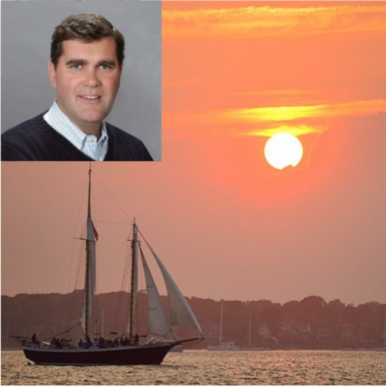
#18
Fred Carpionato, CEO Carpionato Properties
(2013 Ranking: 17)
The developer’s highest profile properties include the Chapel View in Cranston and the Crowne Plaza Hotel in Warwick, but they are just the head of the needle.
He owns and operates many of southern New England's biggest developments - literally millions of square feet of retail and numerous hotels. Over the past two years, he has been looking to be a lead developer on the 195 development.
His teardown of the old Produce Market on the backside of Providence Place Mall has been widely criticized by preservationists. The land still remains vacant today.
He is major donor to Jack Reed's Narragansett Bay PAC and Reed rents office space at his development in Cranston.
#17
Brad Dimeo, CEO Dimeo Construction
(2013 Ranking: NEW)
He is a third generation leader of Dimeo Construction. Walk around Brown University or just about any college, university or hospital campus is the region and you will see a team from Dimeo building. Their diversity includes the award winning Ocean House in Watch Hill - one of America’s most award winning hotels in America and owned and operated by billionaire Charles M. Royce of Royce Funds. Royce is #30 on this year’s list, but only a part-time Rhode Islander.
Dimeo’s firm is building many of Johnson & Wales additions, but reaches to Massachusetts and Connecticut regularly.
Dimeo is active with Crossroads, Board of Directors, Hasbro Children’s Hospital, Advisory Council and is a RIPEC, Trustee.

#16
Carolyn Rafaelian, Founder of Alex and Ani
(2013 Ranking: 6 with Giovanni Feroce)
It has been a tumultuous two years for Alex and Ani and Rafaelian. In the beginning of 2014, she and Feroce had a very public break up and Rafaelian took control of the company. During that period she shed hundreds of employees and revamped nearly the entire management team.
The RI success story which has been among the fastest growing companies in America and was targeting an IPO has restructured and is looking to close out a rebound 2015. That goal may have taken a hit when the company lost its Chief Marketing Officer Ryan Bonifacino going into fourth quarter.
The Alex and Ani involvement, donations and sponsorships in RI has been paired back and Rafaelian has closed two of her three coffee shops - Teas and Javas.
The company reported to have a value in the billions and she is still the largest shareholder. A good holiday season and the karma will be good in Alex and Ani’s world, but a significant shortfall in annual sales and the company’s skyrocketing growth may look a little more mortal.
#15
Habib Gorgi, Managing Partner, Nautic Partners
(2013 Ranking: NEW)
Quietly Nautic Partners has become a significant mid-sized private equity firm. According to the firm's most recent filling with the SEC in 2012, the firm was looking to raise an additional $800 million. This was the seventh round of fundraising by the firm.
Gorgi has been a behind the scenes player in Rhode Island business, but this year became far more public when it was disclosed he was a limited partner in the new ownership group of the Pawtucket Red Sox.
He is partners in Nautic with #28 on this year’s list Bernie Buonanno, III.
#14
Alan Hassenfeld, Former CEO and Chair of Hasbro
(2013 Ranking: 4)
Once the 800-pound business and political leader in Rhode Island, the former CEO and Chairman of Hasbro was a force in pushing for ethics reform in Rhode Island. For the past few years he has taken a lower profile in Rhode Island -- he did however endow the creation of the Hassenfeld Institute for Public Leadership at Bryant University.
The Rhode Island-based Hassenfeld Foundation gave out roughly $4.7 million in donation in the most recently reported year. (Interestingly, one of the Foundation’s holdings was in Mattel stock - Hasbro’s long-time rival).
Recently, Hassenfeld helped the Capital Good Fund’s effort for micro loans with a $100,000 gift.
#13
Buff Chace, Developer
(2013 Ranking: 30)
Chace has been a driving force in creating a new urban living experience in downtown Providence. He has become ever more controversial due to his ongoing demands for tax stabilizations on his projects.
One of his most recent projects is the 170,000 square foot Providence Journal Building in which he is requesting a two-third decrease in the tax assessment as well as a tax stabilization. He has eight buildings in the Westminster Street area.
His official title is founder and managing partner of Cornish Associates. In addition, he’s the managing general partner of Mashpee Commons.
Wildly active in the community, he is chairperson of the Downtown Providence Parks Conservancy and a member of the Executive Committee of the Providence Foundation, and is a director emeritus for GrowSmart RI and a trustee emeritus of Trinity Repertory Theatre.
#12
Tom Ryan, former CEO and Chairman of CVS
(2013 Ranking: 27)
Ryan's retirement has been anything but dull. The URI pharmacy grad who helped to build CVS into one of America’s largest corporations has been involved with two of the biggest initiatives in Rhode Island in the past year.
He and his wife Anne donated $15 million to fund the George and Anne Ryan Center on Neuroscience at URI. This center is one of the cogs in bringing together major educational and health organizations in a broad-based neuroscience initiative in Rhode Island.
The second major initiative Ryan has been involved with has been the effort to move the Pawtucket Red Sox from their home to a Providence Stadium. He and the other owners initially requested more than $120 million in taxpayer support.
Ryan’s neuroscience gift coupled with his fundraising leadership and donations to build the Ryan Center have made him the single biggest individual donor to URI.
#11
Glenn Creamer, Senior Managing Director Providence Equity
(2013 Ranking: 4)
Creamer is a Pawtucket “guy” who has helped to build a $40 billion private equity firm headquartered right here in Providence.
With #2 ranked Jonathan Nelson and #3 ranked Paul Salem, the three along with a team of a few dozen have put Rhode Island on the map for the highest of high finance.
Previous to Providence Equity, Creamer worked in investment banking at Merrill Lynch and J.P. Morgan and received a Master of Business Administration from Harvard Business School and a Bachelor of Arts from Brown University.
While the past couple years have been a bit rough, there have been some solid hits with the sale of Ironman to Wanda Group for $650 million earlier this year which takes some of the sting off the Altegrity loss of nearly $800 million.
#10
Paul Salem, Senior Managing Director Providence Equity
(2013 Ranking: 5)
Salem has been a leader on some of the biggest private equity deals in business such AT&T Canada, Wired magazine, and Hulu.
He along with fellow Brown mates Jonathan Nelson (#2 on this years list) and Glenn Creamer (#11) were Wall Street’s golden boys for more than a decade. But, the past couple of years have taken a little luster of the firm’s momentum.
The collapse of Altergrity and a tough New York Times article were two big hits this past year, but make no mistake about it - with $40 billion and a talented team, they are just one mega-deal away from regaining a position as one of the top firms in the United States.
One of the family’s biggest successes may be by his wife Navyn, who is the founder of Edesia, a global nutrition solution - one of the most heralded efforts to combat hunger. Salem is the Chair of the Board of the education program Year Up.
#9
Scott Donnelly, CEO Textron
(2013 Ranking: 8)
Donnelly heads one of only three Fortune 500 companies headquartered in Rhode Island, and it is Providence’s only one. Textron is ranked #219.
Prior to coming to Textron, he was president and CEO for General Electric (GE) Aviation, the world's leading producer of large and small jet engines. He took the helm of Textron in 2009.
As Chairman, President and Chief Executive Officer at TEXTRON INC, he received $12,150,820 in total compensation. Of this total $1,080,000 was received as a salary, $1,690,000 was received as a bonus, $2,827,898 was received in stock options, $6,477,552 was awarded as stock and $75,370 came from other types of compensation, according to Salary.com.
Textron is one of the world's best-known multi-industry companies. Textron businesses include Bell Helicopter, Cessna, E-Z-GO, Greenlee, Jacobson, Kautex and Textron Systems and Textron Financial Corporation.
#8
John Taylor, Chairman Twin River
(2013 Ranking: 9)
Taylor’s gaming holdings have grown significantly and his big bet has yet to payoff. In 2014, his company purchased the Hard Rock Casino in Biloxi, Mississippi for $250 million. The same year they tried to get approval for another facility in Colorado, but the voters shot them down. This year, Taylor’s company got approval to build a hotel on the Twin River Lincoln campus.
The biggest bet is the company’s acquisition of Newport Grand and the proposal to build a new facility in Tiverton with an expansion of table games. Tiverton is one of Rhode Island’s most rural and beautiful towns — but Taylor has gone door-to-door himself, explaining the benefits and putting his name on the line with residents.
For Taylor who started as an intern from then-Governor Ed DiPrete in the 1980’s, he has come along way and 2016 is a big year.
#7
Christina Paxson, President Brown University
(2013 Ranking: 37)
After a quiet start in her tenure as Brown’s 19th president, Paxson has begun to roll out a number of major initiatives including a $3 billion fundraising campaign. Yes, $3 billion!
Moreover, she has started to be a political force in Providence and Rhode Island wielding significant influence. She was a key player in resolving the nursing school dispute and her “pull the rug” letter ended the PawSox efforts in Providence on the 195 land.
She faces challenges as the Woodrow Wilson Center at Princeton that she ran before coming to Brown, which has become a lightning rod issue about the name-sakes racial legacy, and Brown students are beginning to stir on a number of race-related issues. She recently announced a $100 million effort to study racism.
According tot he Chronicle of Higher Educations review, Paxson earns $739,000 (about one-sixth of her Ivy-League counterpart at Columbia).
#6
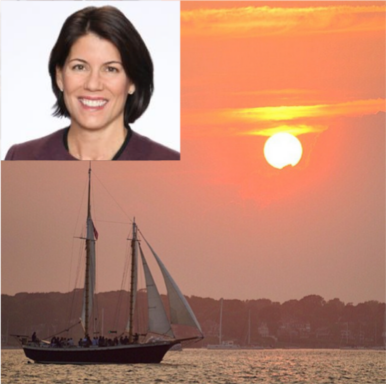
Helena Foulkes, VP CVS
(2013 Ranking: NEW)
Foulkes, like Merlo, has had a good couple of years. She was in part the architect of the removal tobacco from the company’s 7,700 plus stores.
Fortune named her the #26 most powerful woman in business and she now is President of the Retail business.
Her father chairs the RI Convention Center Authority Board, her brother serves on the Commerce Corporation Board and her husband serves of the education board. There is no excuse for not being able to fix RI’s economy over Christmas dinner.
According to Salary.com, Foulkes made $6,064,082 in total compensation. Of this total $850,000 was received as a salary, $3,165,044 was received as a bonus, $624,992 was received in stock options, $1,249,927 was awarded as stock and $174,119 came from other types of compensation.
#5
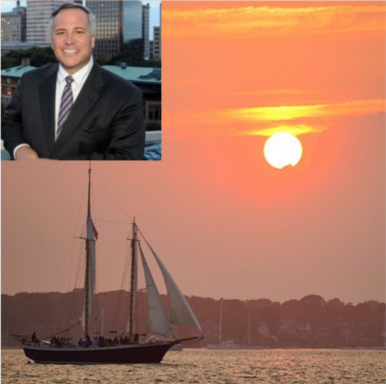
Joe Paolino, Paolino Properties
(2013 Ranking: 12)
If you are standing downtown and look left, right or up, then you are bound to see multiple elements of the Paolino real estate holdings. Never before has one company owned so much of the highest value property in downtown at the same time.
Similarly, it is hard to attend a Democratic Fundraiser without Paolino playing a key role. He is a top fundraiser for Hillary Clinton, helped Buddy Cianci’s failed effort to recapture City Hall in 2014, but even when he loses he seems to win. He failed to get voters in Newport to approve his plan to add table games to Newport Grand and so he flipped the property to Twin River and took his winnings off the table.

#4
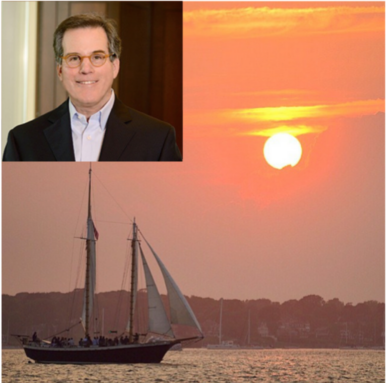
Paul Kazarian, Japonica Partners
(2013 Ranking: NEW)
RI based financier Paul Kazarian bet billions in the Greek debt crisis. The founder and CEO of Japonica Partners was a key player in the battle between Greece and the European Union. Kazarian’s company was one of the largest private bond holders in Greece.
The former Goldman Sachs investment banker first made national headlines when he took control of Sunbean-Oster and made millions when he left as CEO of the company - it was not a happy break-up.
The family's Charles and Agnes Kazarian Eternal Foundation, named in honor of his grandparents, has assets in excess of $160 million (to put in perspective the Champlin Foundation has about $270 million in assets).

#3
Gina Raimondo, Governor of Rhode Island
(2013 Ranking: 18)
Maybe the best resume ever to come out of Rhode Island. Raimondo was elected Rhode Island’s first female Governor and couple that accomplishment with her degrees from Harvard, Yale and a Rhodes Scholarship at Oxford, and she is right there with John Pastore, T.F. Green, and John Chafee.
As General Treasurer she was the darling of the Wall Street Journal and other business publications for pension reform legislation. For many it was perceived as having saved the pension system, but detractors like Forbes columnist and former SEC investigator Ted Siedle claim it just pushed more wealth to Hedge Fund managers who have made hundreds of millions in fees from Rhode Island’s pension funds under Raimondo’s reign.
As Governor, she has proposed a massive funding program to rebuild Rhode Island’s dilapidated infrastructure. The proposal has come under criticism in part for utilizing a revenue bond structure - another program that will generate tens of millions in Wall Street fees.
Her husband Andrew Moffit is a business consultant at McKinsey & Company. Her wealth in part comes from the State of Rhode Island’s investment in Point Judith Capital - she is a shareholder.
#2
Jonathan Nelson, Founder Providence Equity Group
(2013 Ranking: 1)
The past two years have been a challenge for Jonathan Nelson and his Providence Equity Group. Once the golden boys of private equity and lauded for putting together “the biggest deal in the world,” he and the firm have had a series of set backs.
The highest profile bump was the firm’s loss of nearly $800 million in the firm, Altegrity, that was contracted to review federal contractors like Edward Snowden. As GoLocal reported last January, the domino effect of Snowden’s absconding with federal data bases exposed the deficiencies of Altegrity’s vetting process.
As the New York Times wrote in April, “Altegrity was the latest in a string of bad bets for the firm. Last summer, it lost its entire $460 million investment in a for-profit college company after that company faced multiple investigations. Hundreds of millions of dollars were erased when the film studio Metro-Goldwyn-Mayer went bankrupt in 2010. A $675 million stake in an Internet retailer has been written down to zero, as has the $400 million it spent on a Dutch child-care group. The spate of poor investments caused Providence to deliver dismal returns in back-to-back funds.”
Please don’t distress too much over Nelson’s plight, he is still considered Rhode Island’s richest man by Forbes and his Providence Equity Partners still manages a self-reported $40 billion under management.
#1
Larry Merlo, President and CEO of CVS
(2013 Ranking: 7)
Its been a good couple of years for Larry Merlo. In 2014, under his leadership, CVS stopped selling tobacco products which made the company a poster child for being a progressive, pro-health company.
Then, the First Lady, Michelle Obama asked him to be her guest last January at the State of the Union. Also, he scored a compensation package of $32 million in 2014. Not a bad year for the CEO of the 12th ranked company on Fortune 500’s list.
In 2013, Merlo ranked 7th in GoLocal’s 2013 ranking, but his accumulated wealth and his craftsman-like leadership of CVS elevates Merlo to the position of the Most Wealthy and Influential for 2015.


